I continue to be intrigued by the evolution of software architectures and their impact on business. In my 20+ year career, I’ve participated in four of these architecture transitions – the shift from client-server to the internet, the rise of 3-tier architectures underpinning rich internet applications, virtualization that upended the dominance of hardware providers, and now the shift to microservices-based architectures based on cloud infrastructure and software automation.
If you’re building a new application from scratch and are responsible for maintaining its availability and performance, you might wonder whether you should be monitoring logs or metrics. For us, it’s a no-brainer that you’ll want both: metrics are fast and efficient for proactively monitoring the health of your system, while logs are essential for helping to troubleshoot the details of the issue itself to find the root cause.
Graphite Metrics are one of the most common metrics formats in application monitoring today. Originally designed in 2006 by Chris Davis at Orbitz and open-sourced in 2008, Graphite itself is a monitoring tool now used by many organizations both large and small.
“Why does the ‘docker logs’ command fail?“, is one of our frequently asked questions. The answer is simple and mentioned in the Docker documentation: “The docker logs command is not available for drivers other than json-file and journald.”
If you’re part of a large enterprise, you’re probably in the throes of digital transformation. If you’re in IT, you’re supporting your business by rolling out new services and apps weekly (or even daily). Meanwhile, your users expect 24×7 availability and performance. So your IT operations team is having to sift through ever-increasing data pouring out of myriad specialized and fragmented monitoring tools, hybrid clouds, legacy systems and virtual infrastructure.
So you’ve managed to create a truly engaging website with the right content and media and you’re promoting it through the proper channels. But sadly, even after making all the “seemingly” necessary efforts your website isn’t getting the attention it should. Well, have you checked if you’re making the right SEO efforts?
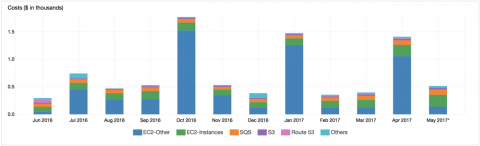
In the first 30 days after moving Cronitor to AWS in January, 2015 we collected $535 in MRR and paid $64.47 for hosting, data transfer and a domain name. In the time since we’ve continued to increase our footprint, level-up instances and add more managed services. Despite the AWS reputation as an expensive foot-gun we’ve improved availability while keeping our bill consistently close to 12.5% of revenue. Here’s a look.
We were in Portland this week attending Monitorama - one of our favorite annual conferences. We got the chance to catch up with old friends, make some new ones, and be part of an amazing community of passionate data and monitoring aficionados. Looking forward to Monitorama AMS in September! Also this week we released Grafana v5.2.0-beta1 and… Elasticsearch alerting has arrived! Download it today and let us know what you think. Check out the specifics on the beta release below.
Many enterprises are at the brink of digital transformation, which entails adopting new technologies that process a sea of both personal and enterprise-level data. Despite a surging number of innovations to prevent evolving cyber threats from hijacking that data, the sheer number of successful, high-profile data breaches and attacks recently highlight the insufficient security practices of organizations around the globe.