Operations | Monitoring | ITSM | DevOps | Cloud

Why cloud repatriation is happening now

Cloud first was gospel for a decade. But the calculus has changed, and organisations are asking harder questions about where their workloads actually belong. In this clip, Civo Product Director Russ Smith breaks down the four forces that have converged to shift the default: spiralling bills that are no longer defensible at scale, the Broadcom acquisition that detonated VMware pricing overnight, sovereignty becoming a boardroom procurement requirement, and AI making new hardware brutally expensive.

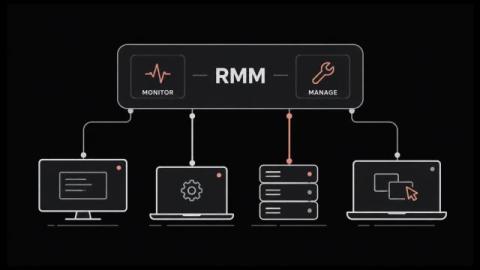
Discover a Hands-Off Approach to Endpoint Management

En football, une faute grave vaut directement un carton rouge. Mais en informatique? Un terminal non corrigé peut rester actif pendant 60 jours — et personne ne s’en aperçoit. Ce genre de jeu dangereux, c’est exactement ce à quoi l’Autonomous Endpoint Management (AEM) met un terme. En agissant comme votre entraîneur, arbitre, VAR et équipe technique — l’AEM surveille en permanence chaque appareil, priorise les risques et résout les problèmes avant qu’ils ne perturbent le match.

Boost Is Now In Public Preview

Today, we’re excited to announce that Boost is moving out of beta and into public preview. After months of building, breaking, and rebuilding inside JFrog’s own R&D organization, Boost is ready for the world. If you are currently running into token limits, unpredictable costs, or runaway usage from AI agents, Boost was built for you. It has already helped our teams reduce token spend while maintaining performance.

5 AT&T Email-to-Text Alternatives to Improve MTTR in 2026

On June 17, 2025, AT&T permanently shut down its email-to-text and text-to-email gateway. Emails sent to @txt.att.net and @mms.att.net stopped reaching phones, and any automated workflow that relied on that address went dark overnight (AT&T support) . For IT Ops, MSPs, facilities and energy ops and incident response teams, this was not a minor inconvenience.

Business intelligence plugins for Grafana: A support update

In January, we announced that Grafana Labs had assumed maintenance of the business intelligence (BI) plugins created by Volkov Labs, and committed to a six-month maintenance period. Today, we’re sharing an update: we're extending our maintenance commitment through the end of 2026. As announced earlier this year, that commitment includes maintaining compatibility with recent Grafana releases while handling bug fixes, security updates, and community contributions on a best-effort basis.

What I got wrong about ClickHouse as a Kafka Person

Kafka is brilliant at moving events around, but sooner or later someone wants to actually query those events, perhaps aggregations, dashboards, or ad-hoc analytics over billions of rows. That is where ClickHouse comes in. It's the option for when stream processing is more than you need, but warehouse query latency is more than you'll tolerate.

Building AI SRE Agents, Part 1: Start Local, Break Things, Learn Fast

The first stage of AI SRE maturity is a laptop, a throwaway cluster, and zero production access. Here’s how to set it up, and what to watch for. AI SRE (Site Reliability Engineering) agents are AI-powered systems that automate the most time-consuming parts of incident response: triaging alerts, correlating logs and metrics, generating root-cause hypotheses, and proposing remediation steps.

Managing Ubuntu on bare metal at scale

Modern infrastructure teams are expected to deliver cloud-like speed, consistency, and reliability, even when their workloads run on physical servers. Bare metal remains essential for many environments: private clouds, Kubernetes clusters, AI infrastructure, edge sites, regulated platforms, and large Ubuntu estates. But operating physical infrastructure at scale is difficult when provisioning, patching, monitoring, and lifecycle management are handled by disconnected tools and manual processes.

When and what should I be logging?

This is a follow-up to Sergiy’s post Errors, traces, logs, metrics: when to reach for what. Modern observability platforms, like Sentry, give developers a lot of choice. For a given problem, should you use traces, profiles, metrics, logs? If you take away one thing from this post, I hope it’s this: when in doubt, start by adding a few targeted log lines.