Mailchimp
Not subscribed to OpsMatters Newsletter


As I’ve written about before, Epinio is built to be very flexible. In this blog, I will highlight several places we can hook into the rest of your existing infrastructure to give you a better experience. If you’re new to Epinio, it’s the application development engine for Kubernetes that lets you to go from code to URL in one step.
Not many companies will tell you why you shouldn’t use their product, but any product that tries to be everything to everyone is doomed to failure. When you build without a specific user in mind, your target becomes the intersection of many viewpoints, and what you build is the lowest common denominator. What usually follows is software that can technically do everything, but feels unfocused, complex, and unpleasant to use. Something everyone is equally unhappy with.
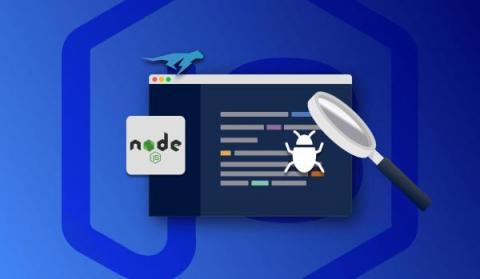
HTTP is the backbone of all API-centric, modern web apps. APIs are the place where the core business logic of an application lives. As a result, developers spend a lot of time optimizing the API business logic. This article addresses a Node.js developer’s dilemma while debugging an HTTP API request. We take a sample Node.js/Express.js-based HTTP service to demonstrate a new way of debugging Node.js applications using the Lightrun observability platform.
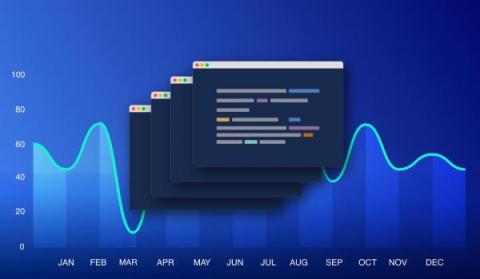
Back in my day, our offices used to have an “open concept” layout – just rows of desks. And at the end of every row was a 720i LCD TV showing 4 to 5 key metrics we’d watch after every release with great concern. While those wallboards sure were beautiful, we rarely had a clear view on how a release was trending. With our latest update to Dashboards, we’re joining form and function with Release Health widgets and a new release filter.
A logging framework is a software tool that helps developers output diagnostic information during the execution of a program. This information is used to debug the program or monitor its performance. There are many different logging frameworks available, starting with simple logging libraries to full-fledged logging and observability platforms.
If you’re unfamiliar with multicloud, it can be tricky to know where to start. This complete guide covers the basics of multicloud, how it could benefit your business, and how to get started.
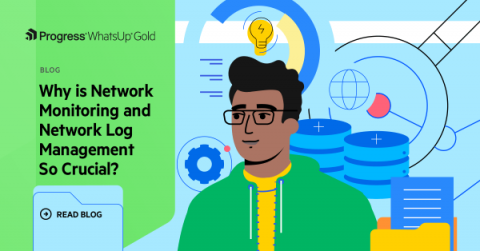
Without Network Monitoring, there is no good way to get a real-time view of your connected environment. But with Network Monitoring reports, you can look backwards to spot problems and trends. Just as vital are logs that deepen this rear-view mirror look, as they contain all the data for all the elements you are monitoring.