Mailchimp
Not subscribed to OpsMatters Newsletter


I recently gave a talk at GrafanaCon LA, which was heavily inspired by my blog post on check output metric extraction. During the talk, I dove into a popular monitoring use case with Sensu, InfluxDB, and Grafana — let’s call it the SIG stack . While I got to share some awesome features in Sensu that ultimately allow users to collect, store, and visualize their metrics, the conference was about Grafana, and folks wanted to see dashboards!
While trying to verify the claims made on a somewhat facile rundown of serverless security threats, I ran across Jeremy Daly’s excellent writeup of a single vulnerability type in serverless, itself inspired by a fantastic talk from Ory Segal on vulnerabilities in serverless apps. At first I wanted to describe how injection attacks can happen. But the fact is, the two resources I just shared serve as amazing documentation; Ory found examples of these vulnerabilities in active GitHub repos!
With the growing number of customers monitoring Azure in Datadog, we saw a great opportunity to help our users get faster visibility across their dynamic cloud environments. We’re happy to announce the release of new out-of-the-box dashboards for several Azure services.
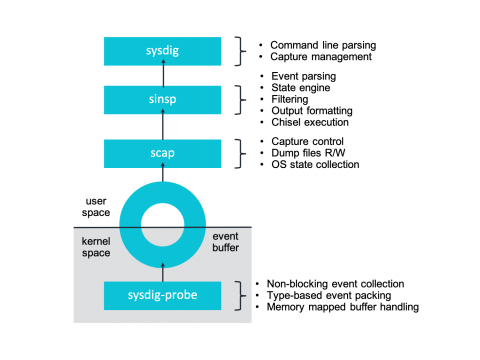
At Sysdig we’ve recently undergone a pretty interesting shift in our core instrumentation technology, adapting our agent to take advantage of eBPF – a core part of the Linux kernel. Sysdig now supports eBPF as an alternative to our Sysdig kernel module-based architecture. Today we are excited to share more details about our integration and the inner workings of eBPF. To celebrate this exciting technology we’re publishing a series of articles entirely dedicated to eBPF.
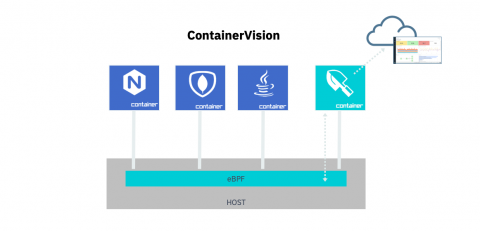
Today we’ve announced that we’ve officially added eBPF instrumentation to extend container observability with Sysdig monitoring, security and forensics solutions. eBPF – extended Berkeley Packet Filter – is a Linux-native in-kernel virtual machine that enables secure, low-overhead tracing for application performance and event observability and analysis.
In a previous post, we introduced a new integration with Microsoft Azure that makes it easy to ship Azure logs and metrics into Logz.io using a ready-made deployment template. Once in Logz.io, this data can be analyzed using the advanced analytics tools Logz.io has to offer — you can query the data, create visualizations and dashboards, and create alerts to get notified when something out of the ordinary occurs.