Operations | Monitoring | ITSM | DevOps | Cloud
APM
The latest News and Information on Application Performance Monitoring and related technologies.
What is N+1 query problem and how distributed tracing solves it?
Top 15 Key Categories of Monitoring Metrics in Kubernetes and OpenShift Environments
Over the last couple of years, Kubernetes (often called K8s) has become the most popular and well-known container orchestration system for automating application deployment, scaling, and management. Scheduling containers at scale in a cloud-native ecosystem is central to the technology. Kubernetes itself is an open-source project, and as such presents challenges for many enterprises especially in regulated industries with strong security requirements and formal SLA commitments.
Core Web Vitals e-commerce analysis: part one
In 2021, Google introduced Core Web Vitals, three criteria to measure if a website is fast, stable, and responsive enough to give visitors a good digital experience. These factor into search ranking and have a powerful influence on customer behavior. But while Google has been urging the web performance community to get on board for more than two years, many are still falling short. We pulled data from the Chrome User Experience Report to conduct our own Core Web Vitals analysis, finding that even some of the largest e-commerce brands aren't passing these thresholds.
Building a one-stop Open Source Observability Platform | OpenObservability Podcast
Observability-as-Code with AppDynamics: CloudFormation and AWS Elastic Container Service (ECS)
In this technical deep-dive, we'll show you how to leverage AppDynamics to observe the state of the Amazon AWS Elastic Container Service.
Splunk APM Expands Code Profiling Capabilities with Several New GAs
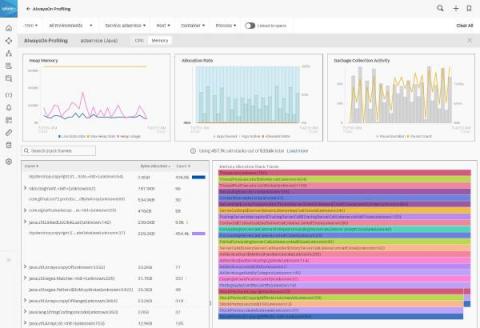
We’re excited to share new Splunk capabilities to help measure how code performance impacts your services. Splunk APM’s AlwaysOn Profiling now supports.NET and Node.js applications for CPU profiling, and Java applications for memory profiling. AlwaysOn Profiling gives app developers and service owners code level visibility into resource bottlenecks by continuously profiling service performance, at minimal overhead.
Why ITOps should care about monitoring application performance
What is FSLogix?
FSLogix is a profile management solution used to apply personalization to user sessions for application and desktop virtualization technologies such as Citrix and Microsoft Azure AVD (Azure Virtual Desktop) and enable “roaming profiles”. It used to be common to copy a profile to and from the network when a user signs in and out of a remote environment. Because user profiles can often be large, sign in and sign out times often became unacceptable.
Product Roadmap Template
A product roadmap helps you say goodbye to scattered information across emails, meetings, and messages. And a typical roadmap includes.


