Operations | Monitoring | ITSM | DevOps | Cloud

APM

The latest News and Information on Application Performance Monitoring and related technologies.

Kubernetes Metrics Server | How to deploy k8s metrics server and use it for monitoring

Modern digital businesses have adopted cloud technology and distributed architectures to enable on-demand scaling of resources. Containerization technologies like Kubernetes and Docker have made it possible to handle customer demands at scale. However, orchestrating a complex microservices architecture with Kubernetes is challenging. Monitoring your Kubernetes cluster can give you insights to better manage your cluster.

Citrix Monitoring Masterclass with George Spiers - Q&A

Citrix monitoring refers to the ability to monitor Citrix services end-to-end. It includes the ability to monitor user experience – from logon time to application launch time to screen refresh latency so administrators can easily monitor and track if they are meeting their service levels (SLAs).

AppDynamics Cloud: Kubernetes Overview

Kubernetes® monitoring with AppDynamics Cloud provides you with the visibility you need into your Kubernetes infrastructure. It provides you the capability to monitor metrics on clusters, namespaces, workloads, pods and ingress controllers. You also have the capability to cross validate metrics from your servers and network interfaces as well as cloud providers. Monitor your pod resources for performance issues or identify needs to scale. Kubernetes, as well as App Service Monitoring, is supported by using an OpenTelemetry™ Operator.

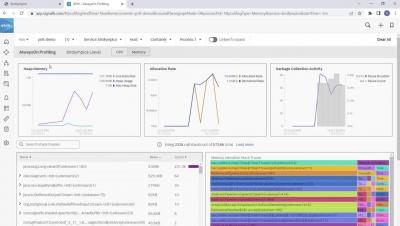
Memory Profiling for Java Applications, a Splunk APM Product Walkthrough

Splunk’s Product Manager Priit Potter walks you through how to identify memory bottlenecks in Java applications, in this detailed product walkthrough. See how Priit troubleshoots his own application, visualizes memory performance problems, and uses flame graphs to detail the line of code responsible for the problem, all with the help of Splunk Application Performance Monitoring.

One-stop Open Source Observability is now a reality with Log Management in SigNoz - SigNal 15

Welcome back to our monthly product updates - SigNal! Our team shipped some major upgrades to SigNoz last month. We’re elated to share that SigNoz is now available with log management. It’s a major milestone in our journey of democratizing observability for developer teams of all sizes. We also shipped an intuitive alerts builder, attended conferences, and played new games in our Friday chit-chats 🥳 A lot of new open source contributors also helped us in making SigNoz better.

Alerting: A Key Part of Application Performance Monitoring

In today’s digital world, users expect to have a seamless experience in their day-to-day applications. To achieve such reliability and stability in our application, information about the health and performance of an application has become necessary for developers to gain insights and fix bottlenecks to provide a seamless user experience. One of the best ways to gain such insights into an application is to use a monitoring system.