Operations | Monitoring | ITSM | DevOps | Cloud

August 2020

Tips for Success When Implementing Your Transformation Initiative

Change isn’t without its detractors in terms of people and systems. A misstep in expanding application performance monitoring (APM) across full-stack application monitoring can result in the degradation of availability and performance, stopping a digital transformation effort in its tracks. Avoid this at all costs. Deploying a full-scale digital transformation is a vast undertaking well beyond the scope of this brief article.

User Experience platform at a fraction of the cost: germainAPM

germainAPM platform allows teams to quickly and cost-effectively lower churn rates and improved user experience. germainAPM monitors and improves User Experience, Process and Technology Performance, in real-time, 24x7. germainAPM is often used to fill-in the gaps of other major APM/BPM/DEM/automation platform since it is so flexible and customizable. Some of the greatest features that germainAPM offers: User Replay feature, Automatic Root-Cause Analysis of issues, Distributed Transaction Tracing, Business Process monitoring/insight, Alerting, Proactively Issue Detection, Automatic Issue Resolution, Tuning Recommendations.

How we scale Raygun's architecture to handle more data

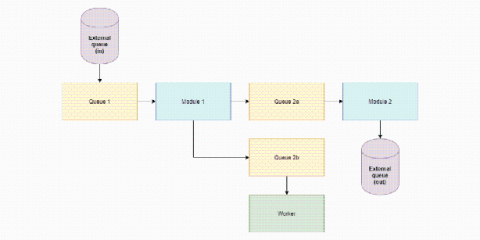
Due to the huge importance of sourcemaps in the workflow of our customers, sourcemaps are a crucial part of our Crash Reporting offering. We constantly strive to stay ahead of our customer demands as the amount of data we process continues to grow. We identified the sourcemapping process as an area ripe for performance improvement, so we took it apart and looked at exciting ways to build it from the ground-up using cutting-edge tech.

What Makes Application Performance Monitoring (APM) So Important?

Recently, it seems like tech companies are coming out with new hardware, software and applications on a daily basis, making it a little hard to keep up with the most current development trends. This is especially important when it comes to application monitoring because it can drastically affect your business as well as the usability of the applications you employ on a daily basis. Pandora FMS wants to offer you some insight into why monitoring is so important, so take a look!

Splunk Redefines Application Performance Monitoring with SignalFx Microservices APM

Splunk has a new Application Performance Monitoring solution purpose-built for monitoring and observability in today’s app-driven world: SignalFx Microservices APM. Learn from Rick Fitz, SVP and GM of IT Markets, and Karthik Rau, Area GM for Application Management, about the new release of SignalFx Microservices APM and how it helps DevOps teams innovate faster, elevate customer experience, and future-proof applications — all while adopting cloud-native technologies and microservices architectures.

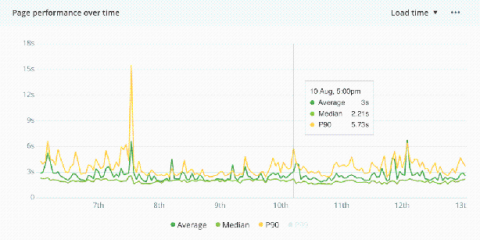
Visualize performance trends over time with the latest graph for RUM

Monitoring trends in application performance helps you identify poor performance and visualize the impact of performance optimizations you’ve made. To help you better monitor performance trends, we’ve released a new line graph now available across all performance details pages in Real User Monitoring.

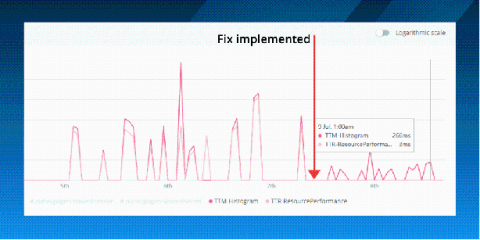
How we made an 83% performance improvement using Real User Monitoring

As applications evolve, we may start to lose visibility into why things are slow. Web apps often suffer in silence as customers are more likely to leave when they’re unsatisfied rather than reach out. Complex user flows, resource-intensive API calls, and an ever-growing codebase can all contribute to poor performance. This is why we don’t have scheduled performance days.

Effortless Load Testing | Simon Aronsson (Load Impact / k6)

Load testing and performance monitoring used to be really hard and bothersome. Not any more! With modern code-first tools and visualisation, being on top of your service scalability and performance is no longer something that's reserved for the QA department. According to research by Google, 53% of mobile website visitors will leave if the page load duration exceeds three seconds. Armed with this knowledge, We'll go through how to implement load tests and performance monitoring around it as well as how to efficiently visualize it.
Sponsored Post

Control the chaos - The importance of monitoring traffic spikes

You've spent years scaling your infrastructure alongside your business growth, and day-to-day, your application performance is thriving. But what happens when your traffic spikes out of your predicted "normal" range, heading into unchartered territory? Are you prepared to support this new influx of customers? Or will you crumble under the pressure of it all - leaving customers dissatisfied at the poor user experience?

AppOptics Product Update Roundup: Q2 2020

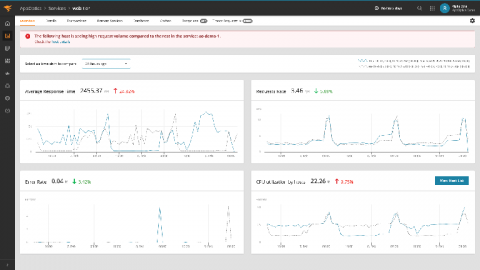
A lot happened last quarter, so you might have missed a few of the shiny new features now included with SolarWinds® AppOptics™. Don’t worry, we rounded up the recent updates here so you can get the most out of your application performance monitoring (APM) with AppOptics. Simplified Application Root Cause and Service- and Trace-Level Root Cause Summary Views The new service- and trace-level views expand the types of IT professionals who can use AppOptics.

Winning with Application Insights Logging

This article will focus on using Azure Application Insights to monitor the real-world business apps. Azure Application Insights is an Application Performance Management (APM) service for developers and DevOps professionals. It is used to monitor an app that is live in real-time. It supports a variety of platforms including .NET, Node.js, Java, and Python hosted on-premises, hybrid, or any public cloud. Application Insights can be used in two ways to monitor your Application.