Operations | Monitoring | ITSM | DevOps | Cloud

The latest News and Information on Monitoring for Websites, Applications, APIs, Infrastructure, and other technologies.

Manage IT on the go with our incredibly effective mobile apps!

Even an insignificant network issue can wreck havoc on your IT infrastructure when left unmanaged. This makes it vital that your IT team is alerted instantly whenever an issue arises, so they can troubleshoot it quickly, and ensure network stability. However, IT teams aren’t sitting at their desks waiting for problems to happen. It’s not uncommon for IT staff to be away from their workstations addressing network issues such as a router failure or a faulty LAN cable.

How to debug Android Chrome from Windows, Linux, or Mac

Testing and debugging websites and web apps on mobile devices can be challenging. Browsers on phones and tablets often don’t have built-in debuggers, and emulating mobile devices is never as accurate as you’d like. To debug mobile websites on Android, the desktop version of Chrome provides a solution with remote debugging. This article will show you how to use remote debugging with Chrome from your computer. You can use one of the common desktop operating systems like Windows, macOS, or Linux.

Microservices Monitoring: Using Namespaces for Data Structuring

Microservice architecture is a software design pattern in which we write applications by combining several small programs. These programs, which are called microservices, work together for a common goal. For some teams, it takes a lot less time and effort to write several small applications than a single large one.

Infrastructure Monitoring: A look back and the way forward

2020 has definitely been new, different, strange, unpredictable, and more. With new normal becoming a buzzword, adapting and surviving through these challenging times has been quite a task. We, at Site24x7, prioritized the safety of our employees, their families, and all our customers and business associates at the outbreak of the coronavirus (COVID-19). At the same time, customer queries and their feature requests were handled to manage the sudden surges in demand for existing and new features.

Monitoring Heroku apps with Atatus

Heroku was developed by James Lindenbaum, Adam Wiggins and Orion Henry to provide services, workflows and polyglot support to enhance developer productivity. Heroku is a container-based cloud Platform as a Service (PAAS). With Heroku, developers can deploy, manage and scale modern applications. Initially, Heroku supported only Ruby but later it added support for Java, Node.js, Python, PHP etc.

Bringing override sprawl under control with PowerBI

Picture this scenario - the final SQL 2008 server is decommissioned and all replacement SQL servers are monitored using the SQL version agnostic MP - finally! But, before cracking open the bubbly, you will want to pull out the MPs relating to SQL 2008 from SCOM. Easy…? Just delete them from the console… wrong!

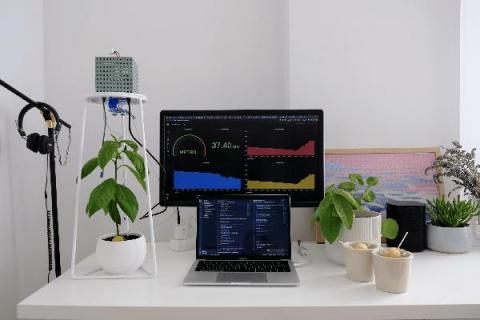
How using Grafana (and plugins) gave a jolt to Smart State Technology, a company advancing technology for energy infrastructures

Smart State Technology (SST) is a company based in the Netherlands that develops advanced technological and future-proof solutions for smart grids. Their mission is to reinforce critical energy infrastructures by providing innovative energy solutions that connect industry and research, while ensuring society can fully benefit a sustainable energy future.

Find logs fast with new "tail -f" functionality in Cloud Logging

When you’re troubleshooting an app or a deployment, every second counts! Cloud Logging helps you troubleshoot by aggregating logs from across Google Cloud, on-premises or other clouds, indexing, aggregating logs into metrics, scanning for unique errors with Error Reporting and making logs available for search, all in less than a minute. And now, we’ve built two new features for streaming logs to give you even fresher insights from your logs data.