Operations | Monitoring | ITSM | DevOps | Cloud

Introducing Atatus Log Monitoring

Log Monitoring is a crucial step in ensuring to know what’s happening in all your servers from a single location. Did you know Log Monitoring tools are implemented by the strategy called “defense-in-depth”? Boom!!! That’s where the log monitoring concept developed, and now we have many log monitoring tools in the market. Issues that users face in the log monitoring tool: We considered all the above points while we designed our tool.

What's new in Grafana Cloud for March 2021: improvements to alerting, synthetic monitoring, and more

As the product manager for Grafana Cloud, I am constantly following the progress of all the new features that our engineering teams are working on, from early ideation to release. We’re always excited to share updates with the community, so you can all try them out and let us know what you think. So each month, I’ll be rounding up the latest Grafana Cloud features and improvements on the blog.

Visualize your DevOps data for free

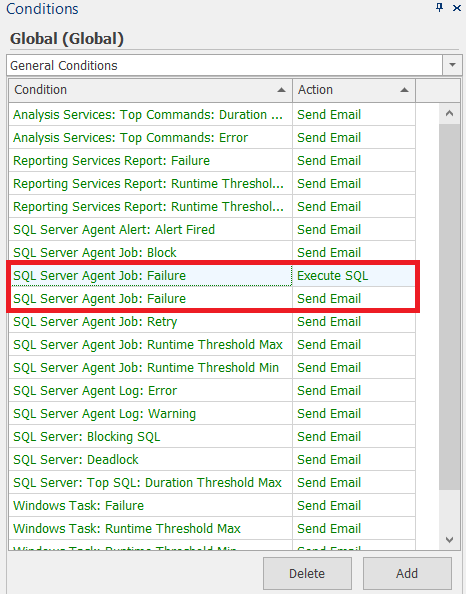
We recently launched the public preview of a new tool that lets anyone dashboard anything – for free. Meet Dashboard Server! You can download it free because we wanted to get our incredible dashboards in the hands of more people. The SCOM community know us well but our dashboards are perfect for so many use cases beyond System Center monitoring. And if you love them as much as we think you will, all we ask in return is that you share that love by spreading the word.

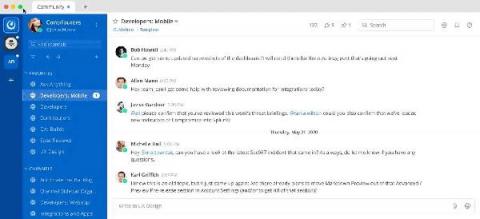
Mattermost Incident Collaboration now includes improved communication, automation, and history for incident response teams

Teams are always looking for a speed advantage, and that comes from planning, crisp execution, and teamwork. To this end, we’re excited to release new enhancements to Incident Collaboration to help make life easier for DevOps teams during incident response. The Mattermost platform includes built-in Incident Playbooks with predefined response plans and task lists. Playbooks can be customized to your environment and specific use cases.

Logz.io's Prometheus-as-a-Service is Generally Available

Today, Logz.io is thrilled to announce that Prometheus-as-a-service is now generally available for anyone to try themselves! I’d like to thank the Logz.io village for executing a huge milestone on our quest to unify the best open source monitoring tools on Logz.io’s scalable cloud platform.

What's new in Grafana Enterprise Metrics for scaling Prometheus: enhanced access control and a compactor that supports 650 million active series and beyond

I’m a fresh starter here at Grafana Labs, leading one of our teams working on the Grafana Enterprise Stack. As a longtime user of Grafana, I couldn’t wait to see what’s new in versions 1.1 and 1.2 of Grafana Enterprise Metrics (GEM), our scalable, self-hosted Prometheus service. I tried out the shiny features and wanted to share some of the cool things I found.

Skylight 5: Now with Source Locations!

This week we released Skylight version 5.0, which represents a major undertaking that has involved every person at Tilde and every part of our ever-growing stack. In addition to major internal refactors, this release also modernizes our native Rust code, and introduces Skylight's newest feature, Source Locations.

Grafana Loki 2.2 released: Multi-line logs, crash resiliency, and performance improvements

I imagine everyone is long since tired and bored with their Loki 2.1 end of year/holiday gift, so I’m here today to bring some really exciting news. Loki 2.2 is released!!! New to Loki? Want a refresher? Owen Diehl and I did a webinar not long ago. Check out the on-demand video for a good overview of what Loki is capable of in 2021! Lots of new features are in this release, but worth celebrating in particular is that the single most requested feature for Loki has been added!

What's New with Ivanti Device and Application Control 5.3

What’s New in Ivanti Device & Application Control 5.3 Nearly every company in the world incorporates a Mac endpoint into the organization. Without a device control solution to manage these stations we see a real possibility for data leakage risk. This loss happens mainly because of insider threats. Ivanti Device and Application Control has historically performed well protecting our customers against these types of threats, but the Mac endpoints can still represent a risk.