Operations | Monitoring | ITSM | DevOps | Cloud

Monitoring

The latest News and Information on Monitoring for Websites, Applications, APIs, Infrastructure, and other technologies.

How to Clear Up Alert Storms by 90%?

Alerts are notifications from AIOps monitoring tools that indicate that there is an anomaly. IT teams get these alerts on their monitoring dashboard via emails or enterprise collaboration tools such as Slack or Teams. Service level agreements expect IT teams to analyze every alert within a specific timeframe and take appropriate action.

How to Control Alert Fatigue?

Alerts are indispensable to any IT operations system today. Site reliability engineers (SREs) or ITOps executives set up several monitoring tools for their IT landscape. When there is a change, high-risk action, or outage in any of these incidents, the monitoring tool triggers an automated alert. This could happen on the monitoring tool’s dashboard itself, via email, or enterprise collaboration tools like Slack or Teams.

What Is Cloud Monitoring? 13 Best Practices For Complete Visibility

Cloud computing offers several undeniable benefits to businesses. Some of the biggest ones are agility, cost savings, data recovery, and developing new apps and services to meet changing customer needs. Despite these benefits, the cloud can be complex, demand specialized skills, and require companies to follow up-to-date cloud security best practices. Why is that a problem? A 2020 report shows that 68% of companies cited misconfiguration as their biggest cloud architecture challenge going into 2021.

Maintaining reliable services with advanced Cloud Logging features

We’ve covered ingesting, routing, storing, and viewing logs from your services in Cloud Logging already, but what else can you do with all that data? In this episode of Engineering for Reliability, we show how you can use advanced features like alerting on logs, logs-based metrics, and capturing application exceptions in Error Reporting. Watch to learn how you can find issues faster, make your services more reliable, and keep your users happy.

The Five Data Pillars of Effective Root-Cause Analysis

The most effective way to understand an incident, resolve it and prevent it from occurring again is root-cause analysis. Simply put, root-cause analysis is the study performed by ITOps teams or site reliability engineers (SREs) to pinpoint the exact element/error that caused the unexpected behavior. Based on this, they plan remediation. Accurate and timely root-cause analysis can have a direct impact on the company’s top and bottom line.

Automate and Virtualize the NOC: A Gannett/USA TODAY Network Case Study

Mission creep is a phenomenon that occurs after a project begins and gains momentum, but then gradually grows beyond the original, intended scope. One day you wake up and realize that, instead of an efficient, manageable project, you’ve got a monster on your hands. For enterprises in the midst of dynamic growth, IT infrastructure is often beset by mission creep. The incumbent organization acquires smaller operations, integrates their technology, and soon things are out of control.

Cloud or On-Prem? With Monitoring, It's Both-And, Not Either-Or

Despite the migration of services and systems to cloud (either all or in part), many of the fundamental aspects of the day-to-day work IT practitioners do hasn’t changed. It’s just moved. In this session, SolarWinds Head Geek Leon Adato and Technical Content Manager for Community Kevin M. Sparenberg discuss that state of affairs, as well as what monitoring can do to help view those resources as a contiguous whole, despite possibly being split across the on-prem/cloud divide.

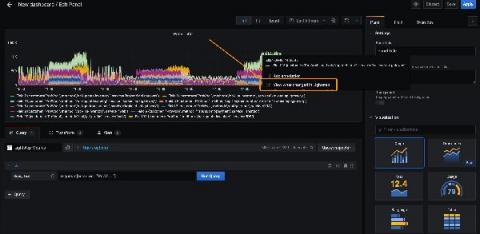
Introducing the Lightstep Metrics plugin for Grafana

Chris Sackes is a Software Engineer at Lightstep. A New Yorker by birth, he loves public transportation, architecture photography, and urban exploration. He’s spent the last five years engineering delightful user experiences for a variety of applications. Lightstep’s powerful metrics reporting and analysis are now available for Grafana users. Using the new Lightstep Metrics plugin for Grafana, you can view metrics data reported to Lightstep directly in your Grafana instance.

Using Satellite Server for distributed environment monitoring

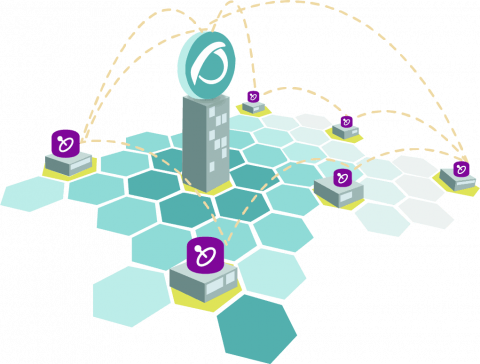
Today we will talk about one of the most versatile elements that Pandora FMS Enterprise offers us for monitoring distributed environments, the Satellite server. It will allow you to monitor different networks remotely, without the need to have connectivity directly from the monitoring environment with the computers that make it up.