Operations | Monitoring | ITSM | DevOps | Cloud

Monitoring

The latest News and Information on Monitoring for Websites, Applications, APIs, Infrastructure, and other technologies.

The 95th Percentile: How to Manage Capacity Before You Run Out

One of the largest challenges with network bandwidth metering is the way traffic flows. Traffic comes in bursts. It’s never a constant, predictable stream of data you can measure once, spec hardware for and be done with (wouldn’t that be nice?!). Instead, you need to account for the dynamic nature of bandwidth utilization and its impact on performance. You’ll never be able to predict every burst of traffic your network experiences.

Cloud or On-Prem? With Monitoring, It's Both-And, Not Either-Or

Despite the migration of services and systems to cloud (either all or in part), many of the fundamental aspects of the day-to-day work IT practitioners do hasn’t changed. It’s just moved. In this session, SolarWinds Head Geek Leon Adato and Technical Content Manager for Community Kevin M. Sparenberg discuss that state of affairs, as well as what monitoring can do to help view those resources as a contiguous whole, despite possibly being split across the on-prem/cloud divide.

Introducing the Lightstep Metrics plugin for Grafana

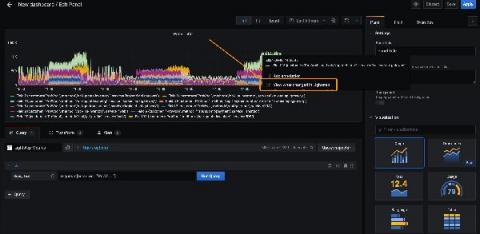
Chris Sackes is a Software Engineer at Lightstep. A New Yorker by birth, he loves public transportation, architecture photography, and urban exploration. He’s spent the last five years engineering delightful user experiences for a variety of applications. Lightstep’s powerful metrics reporting and analysis are now available for Grafana users. Using the new Lightstep Metrics plugin for Grafana, you can view metrics data reported to Lightstep directly in your Grafana instance.

Using Satellite Server for distributed environment monitoring

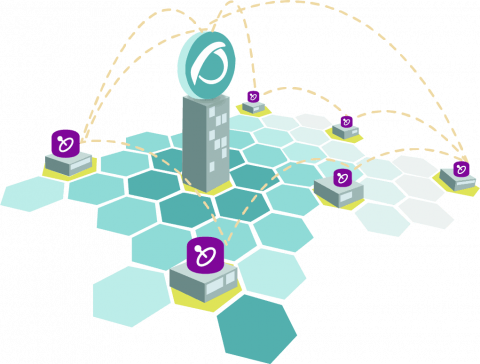
Today we will talk about one of the most versatile elements that Pandora FMS Enterprise offers us for monitoring distributed environments, the Satellite server. It will allow you to monitor different networks remotely, without the need to have connectivity directly from the monitoring environment with the computers that make it up.

Monitoring Amazon cloudfront with Graphite via Graphite APIs

MetricFire offers a complete system, infrastructure, and application monitoring using a suite of open-source monitoring tools. With MetricFire, you can monitor all your infrastructure on a single dashboard. The platform displays metrics on the dashboard using either Hosted Prometheus or Graphite-as-a-Service.

Taming Rails Logging with Lograge and LogDNA

Rails is a classic on Ruby for a reason. The framework is powerful, intuitive and the language has a low entry bar. However, being designed when systems existed on a single server, standard Rails logging is excessively fractionalized. Even on a single server, a straightforward call can quickly turn into seven unique, unconnected logs.