Operations | Monitoring | ITSM | DevOps | Cloud


The latest News and Information on Monitoring for Websites, Applications, APIs, Infrastructure, and other technologies.

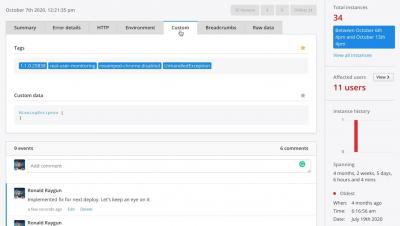
How to drill into error details with Raygun Crash Reporting
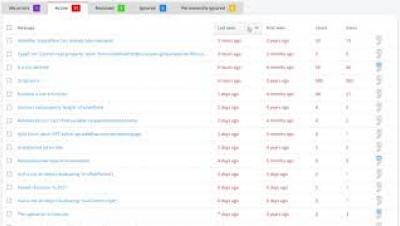
How to sort errors in Raygun Crash Reporting

Everything You Need to Know About Google Cloud Logs
As the affordable choice for cloud computing, Google Cloud Platform (GCP) is catching up to its competitors, like AWS and Microsoft Azure. As a business, you need the speed and scalability that the cloud provides, but you want to limit your costs to ensure you hit revenue targets. With GCP, you found a digital services business partner to help you meet your business objectives, a technology that gives you the service availability you want at the speed you need.

Two Methods for Connecting to InfluxDB 3.0
InfluxDB 3.0 has 10x better storage compression and performance, supports unlimited cardinality data, and delivers lightning-fast SQL queries compared to previous versions. These gains are the result of our new database engine built on top of Apache Arrow. Apache Arrow processes huge amounts of columnar data and provides a wide set of tools to operate effectively on that data.

Maximizing ROI By Reducing Cost of Downstream Observability Platforms With BindPlane OP

Gain visibility into your Cloudera clusters with Datadog
Cloudera Data Platform (CDP) is a data analytics and management platform that enables users to centralize, visualize, and govern their data. While users may be accustomed to data analytics solutions that are completely siloed and difficult to scale, CDP is designed to be flexible, giving customers the ability to integrate with open source technologies and deploy in a hybrid, cloud-native, or multi-cloud environment.

Elastic for Public Sector

Top 10 Website Monitoring Tools of 2023
In today’s digital landscape, where websites and online services play a crucial role in businesses’ success, having continuous uptime and optimal performance is of the utmost importance. This is where website monitoring tools come into the picture. Monitoring tools act as our vigilant sentries, constantly watching over our websites, servers, and applications to detect any issues that may affect their availability or performance.

Monitoring smart cities with Grafana, Timescale, and Sentilo
Miquel is a Project Manager at Seidor Opentrends, focused on smart cities, data, and IoT projects. Seidor Opentrends, which is headquartered in Barcelona and has offices around the world, provides end-to-end, high quality IT transformation services and serves as a consultant on open source and software architecture for municipalities throughout Spain. At Seidor OpenTrends, we build and maintain Sentilo, an open source sensor and actuator platform for smart cities.