Operations | Monitoring | ITSM | DevOps | Cloud

Monitoring

The latest News and Information on Monitoring for Websites, Applications, APIs, Infrastructure, and other technologies.

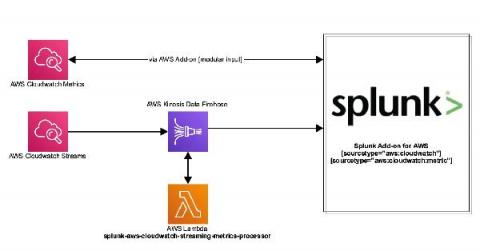
Stream Your AWS Services Metrics to Splunk

Amazon Web Services (AWS) recently announced the launch of CloudWatch Metric Streams. Cloudwatch Streams can stream metrics from a number of different AWS resources using Amazon Kinesis Data Firehose to target destinations. The new service is different from the current architecture. Instead of polling, metrics are delivered via an Amazon Kinesis Data Firehose stream. This is a highly scalable and far more efficient way to retrieve AWS service metrics.

Remote Employee Strategies That Work - Tips From HR & IT

With the right combination of tech and internal communications, you can do a huge amount to actually increase the wellbeing and value a remote employee feels they’re getting from your business. Unfortunately, a lot of businesses struggle to do this, at least on a continual basis.

SLA Compliance: The Service Desk & ITSM Metric Explained

IT solutions are either utilized as a service or procured from third-party vendors by organizations of all types and sizes. This enables organizations to gain access to reliable IT technologies without having to internally build, operate, or manage the underlying systems. As a result of this, both the organization and the solutions provider sign a service-level agreement (SLA), which commits the vendor to deliver services that meet the established performance requirements.

New Features: Heroku Errors and a Magic Dashboard

We have been collecting Logplex data for our Heroku customers for a while now. With that data we create Magic Dashboards for Postgres and Redis integrations, and track Heroku Host Metrics. Starting today, we also extract error incidents from Heroku Logplex data and provide you with a magic dashboard for Heroku status codes.

Unravel the hidden mysteries of your cluster with the new Kubernetes Dashboards

One of the greatest challenges you may face when creating Kubernetes dashboards is getting the full picture of your cluster. Kubernetes is the de-facto standard for container orchestration, but it also has a very steep learning curve. We, at Sysdig, use Kubernetes ourselves, and also help hundreds of customers dealing with their clusters every day. We are happy to share all that expertise with you in the Kubernetes Dashboards.

ICYMI: How Honeycomb Can Help You Achieve the Deployment Part of CI/CD

In case you missed it, this webinar includes code walkthroughs that help you to add observability to your pipelines (using a free Honeycomb account!) so that you and your team can speed up your deployments to prod. This is also a risk-free way to get started with observability if your team isn’t quite yet ready to change your production apps.