How to Stay Proactive With DRE Monitoring and Alerts
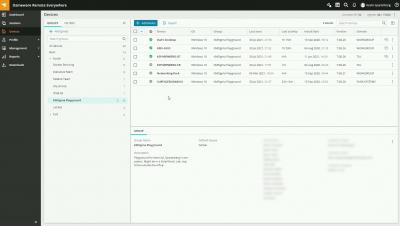
Keep up with recurring issues or react when a device is down with Dameware Remote Everywhere’s new Monitoring and Alerts. This feature allows IT pros to monitor and receive alerts on Windows devices.