Operations | Monitoring | ITSM | DevOps | Cloud

The latest News and Information on Monitoring for Websites, Applications, APIs, Infrastructure, and other technologies.

Scaling Observability for Dexory's Global Fleet of Autonomous Robots with Grafana Cloud:

Join Dexory's VP of Software, Matt MacLeod, as he explains how Dexory, a Grafana Labs customer, uses Grafana Cloud to monitor and manage a global fleet of autonomous robots for warehouse inventory. Hear about Dexory's journey from prototype to scalable observability solution, the challenges of high-frequency data collection in harsh environments, and how advanced monitoring enables proactive issue resolution. Discover Dexory’s insights on improving customer satisfaction and lowering operational costs through effective observability practices.

6 Benefits of Remote Monitoring and Management for Your Clients' IT Infrastructure

Effective management of IT infrastructure is essential for any business looking to minimize interruptions, enhance system performance, and secure a competitive advantage. Among those benefiting from these tools are managed service providers (MSPs), who play a pivotal role in optimizing and securing IT infrastructures for a diverse clientele. In today's complex business landscape, managed service providers are crucial to achieving sustained operational efficiency and resilience in IT systems.
Sponsored Post

AI Operations: Integrating Agentic AI for Seamless Workflow Automation

With agentic AI integrated, seamless workflow automation in IT operations is now achievable. By utilizing this advanced AI, organizations can achieve autonomous systems that respond in real-time and learn and adapt, creating operational efficiencies that reduce manual oversight. CloudFabrix, a provider of AI-driven IT solutions, leverages agentic AI to transform complex workflows, reduce manual workloads, and help organizations become more resilient and agile.

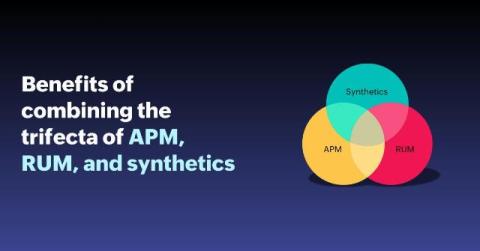
Stop Guessing, Start Knowing: The Power of Integrated Logging and APM

‍ Let’s talk about something we’ve all experienced: a customer reports that their checkout process is “sometimes slow,” – or maybe you noticed an unexpected spike in response times. So, you dive into the logs, grep through thousands of lines, and try to match timestamps with your APM traces. Sound familiar? At Scout, we’ve seen countless engineering teams struggle with this disconnect between their logging and APM tools.

Grafana Cloud updates: redesigned dashboard filters, more ways to use RBAC, and more

We consistently roll out helpful updates and fun features in Grafana Cloud, our fully managed observability platform powered by the open source Grafana LGTM Stack (Loki for logs, Grafana for visualization, Tempo for traces, and Mimir for metrics). In case you missed them, here’s our monthly roundup of the latest and greatest Grafana Cloud updates. You can also read about all the features we add to Grafana Cloud in our What’s New in Grafana Cloud documentation.

Planet of the APIs: A Master Class on Monitoring Transactions in the Wild

APIs are the crucial, hidden heroes for today's connected world, but poor performance or failure can negatively impact user experience. Proper API monitoring and testing are essential. Watch this technical session exploring how proactive API transaction monitoring can fulfill a variety of use cases, e.g. performance, regression, and functional monitoring. Learn best practices for monitoring APIs in real-world scenarios.

Avoid Rate Limiting with Query Batching

This post is part of our debugging series, where we share tricky challenges and solutions while building Sentry. On March 4th, 2024, the most metal incident happened - INC-666 INC-666, in a nutshell, was where the issue alert rule post-processing step was flooded with more load than it could handle, and alerts that were supposed to have fired did not. This means that Sentry customers might not be receiving alerts if the query that would have triggered the alert is rate-limited.