Operations | Monitoring | ITSM | DevOps | Cloud

Monitoring

The latest News and Information on Monitoring for Websites, Applications, APIs, Infrastructure, and other technologies.

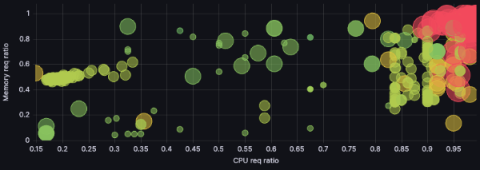
How Grafana Labs switched to Karpenter to reduce costs and complexities in Amazon EKS

At Grafana Labs we meet our users where they are. We run our services in every major cloud provider, so they can have what they need, where they need it. But of course, different providers offer different services — and different challenges. When we first landed on AWS in 2022 and began using Amazon Elastic Kubernetes Service (Amazon EKS), we went with Cluster Autoscaler (CA) as our autoscaling tool of choice.

Unleashing the Dynamic Duo: Supercharging Productivity with Liquit Workspace and eG Innovations Monitoring Solution!

A guest blog from Donny van der Linde, Pre-Sales Consultant at eG Innovations’ partner Liquit covering how to leverage eG Enterprise’s monitoring in combination with Liquit Workspace technologies to build powerful proactive contextual access workflows to support automated application delivery. An example using eG Enterprise’s user experience metrics to trigger remediation via Liquit Smart Icons is given.

Building Dashboard and Dashboard Inputs in Cribl Search

This blog demonstrates how to create “inputs” to Cribl Search dashboards. An Input is a control widget that we can add to our Dashboards to control how they execute. They allow the user to supply a range of inputs to customize one or many of the Searches in each of the panels on a given dashboard. Currently, there are four types of inputs: a time picker, a dropdown, a string, and a number. This blog shows how to create all four types of Inputs on a dashboard using built-in sample data.

PX5 Announces Tracealyzer Support for PX5 RTOS

A little more than a month ago, we released the free Tracealyzer SDK – a toolkit that allows other embedded software vendors to integrate Tracealyzer recording in their own software. At that time, the development team at PX5 in California were already hard at work combining Tracealyzer with their PX5 RTOS, and yesterday they released the integration. Built with Percepio’s SDK, in a just a few weeks.

More is More - A Case for Dynamic Observability

Dynamic observability is the concept that the amount of data collected should scale based on signals from your environment. Elastic infrastructure is not a new concept. Much of the internet is powered by services that provision more resources based on signals derived from metrics like cpu load, memory utilization and queue depth. If we can use tools to right size our infrastructure, why can’t we also use tools to right size the amount of data we collect?

What is SLA? How to Handle SLA Breaches?

Service Level Agreements (SLAs) are foundational contracts that define the expectations and commitments between service providers and their customers. These agreements outline the quality, performance, and availability of services, setting the stage for a harmonious relationship. However, as service environments grow increasingly complex, the risk of SLA breaches looms ever larger.