Operations | Monitoring | ITSM | DevOps | Cloud

Monitoring

The latest News and Information on Monitoring for Websites, Applications, APIs, Infrastructure, and other technologies.

El Salvador's government health care institution delivers exceptional medical services leveraging OpManager

Instituto Salvadoreno del Seguro Social (ISSS), an El Salvador based government health care institution, provides medical services such as treatment, insurance, prescription home delivery, etc. The institution has branches in over 114 locations throughout the country, with its IT infrastructure network being very crucial for its business operations. To monitor its business critical IT network, ISSS’ IT team evaluated and chose ManageEngine OpManager.

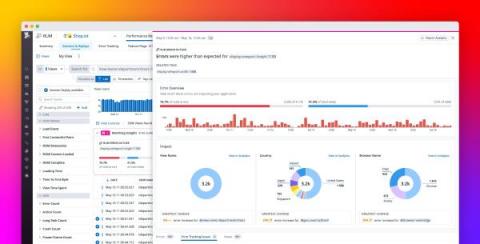
Automatically identify and efficiently investigate frontend issues with RUM Watchdog Insights

When your applications are experiencing degraded frontend performance, every minute of investigation counts towards minimizing the impact of regressions on your users. That’s why we built Watchdog Insights, an AI-powered recommendations engine that augments monitoring investigations by intelligently surfacing data that sheds light on outliers in the errors and latency affecting your applications.

Distributed tracing Node.js- OpenTelemetry-based monitoring

As the trend toward microservices-based architectures continues to gain momentum, it’s becoming increasingly clear that distributed tracing will be a crucial tool for monitoring and debugging these complex systems in the future. When designing a microservices-based architecture, breaking extensive services into smaller, more manageable components is standard practice. Communication between these components becomes crucial, but finding the root cause can be challenging when issues arise.

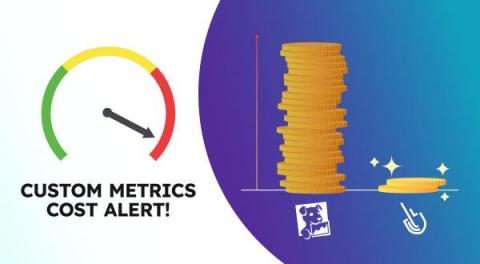
Did Your Datadog Bill Explode?

Custom metrics is a key component for many companies. Stock available in warehouses, shopping cart status, number of products sold, and operational status for industrial machines are some of the many KPIs that companies need for their own business tracking purposes. When it comes to custom metrics and observability platforms costs, many companies are struggling to find a good balance between availability, performance, reliability, and costs.

How to monitor Snowflake with Grafana Cloud

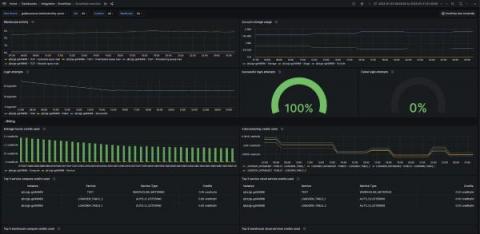
Snowflake is a cloud-based data warehousing platform that allows organizations to store, manage, and analyze large amounts of data. It offers a scalable, secure, and highly available solution that separates storage and computing resources. We already offer the Snowflake datasource plugin, which allows you to query and visualize data from your Snowflake Data Cloud on your Grafana dashboards.

Best Grafana dashboard for Graphite Metrics

It is an old cliche adage, but there is no better statement than “a picture is worth a thousand words” that explains the effectiveness of visuals to deliver a message. Especially, in the data domain where a raw message often exists in numbers, visualizing graphs and charts is the best way to share information. When it comes to visualizing metrics from Graphite, there is no solution that can beat Grafana.

Exponential Smoothing: A Beginner's Guide to Getting Started

Exponential smoothing is a time series forecasting method that uses an exponentially weighted average of past observations to predict future values. This method assigns more weight to recent observations and less to older observations, allowing the forecast to adapt to changing trends in the data. The resulting forecast is a smoothed version of the original time series less affected by random fluctuations or noise in the data.