Mailchimp
Not subscribed to OpsMatters Newsletter


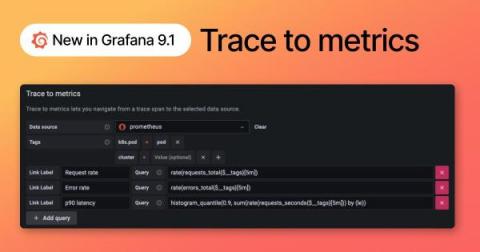
Traces, logs, and metrics provide inherently different views into a system, which is why correlating between them is important. With features like exemplar support, trace to logs, and span references, you can quickly jump between most telemetry signals in Grafana. With the release of Grafana 9.1, we’re improving Grafana’s ability to correlate different signals by adding the functionality to link between traces and metrics.
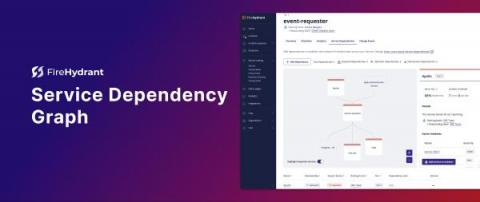
Understanding the impact and scope of an incident when degradation occurs is critical for returning your service online. This requires modeling the many downstream and upstream relationships between your services. Our new Service Dependency Graph provides a shortcut – a way to surface dependencies quickly, understand the relationship between services, and determine the scope or impact of an incident.
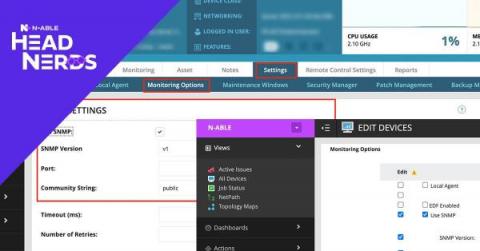
I’m a recent entrant to the Website Monitoring game, but there is one thing I realized straight away: A Monitoring tool is only as good as it’s configured to be. Website monitoring is at its best when it’s reliable, informative, and efficient. When it gives you the information you need, when you need it, and the peace of mind to say “if I’m not being alerted, I know it’s still working.”
While it is fair to say that in recent years we’ve seen a shift to servers being deployed in the cloud through Microsoft Azure or AWS, I’m sure if you’re reading this today you still have a large percentage of physical servers under your management, including Hyper-V and ESXi hosts. N-central’s ESXi monitoring should automatically detect and monitor the hardware in these boxes, but what about the rest?
There are a number of challenges to surmount for enterprises in the IoT sector, including having a short time to market, airtight security, a versatile update mechanism for hardware and software and mastering device management. The more planning and practical steps that are taken to address key considerations, the faster an IoT project can get to market and make an impact on the world.
The scenario: you want to see distributed traces, maybe for your web app. You’ve set up an OpenTelemetry collector to receive OTLP traces in JSON over HTTP, and send those to Honeycomb (how to do that is another post, and we’ll link it here when it’s up).