Operations | Monitoring | ITSM | DevOps | Cloud
opsdemon
Latest posts
6 Open Source SIEM Tools
Helping to protect IT environments from cyber attacks and comply with tightening compliance standards, SIEM systems are becoming the cornerstone for security paradigms implemented by a growing number of organizations.
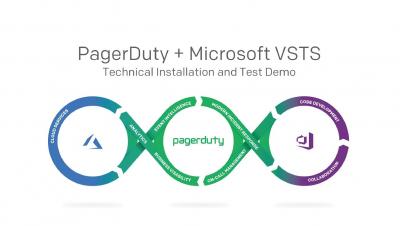
PagerDuty Microsoft VSTS Integration Installation and Test Video
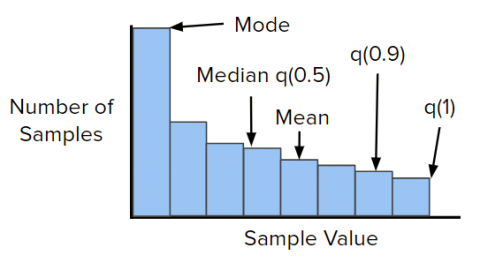
Effective Management of High Volume Numeric Data with Histograms
How do you capture and organize billions of measurements per second such that you can answer a rich set of queries effectively (percentiles, counts below X, aggregations across streams), and you don’t blow through your AWS budget in minutes? To effectively manage billions of data points, your system has to be both performant and scalable. How do you accomplish that? Not only do your algorithms have to be on point, but your implementation of them has to be efficient.
LogDNA | Next Generation Log Management
We've come a long way together ... Icinga turns 9
Born to be wild. We’ve been busy with bringing Elasticstack integration into full shape with the Icinga 2 feature and the corresponding Icinga Web 2 module. Both of them were thankfully funded and sponsored by VW. Elasticsearch 6 support is sponsored by a customer too, this will hit 2.9 later in June. Earlier in 2017 we’ve also released the Logstash output for Icinga.
PagerDuty Helps Microsoft Azure and Visual Studio Customers Manage Incidents in Real Time and Migrate Confidently to the Cloud
SAN FRANCISCO – May 7, 2018 – Today at Microsoft Build 2018, PagerDuty, a global leader in digital operations management, announced integration of PagerDuty’s real-time operations management platform with Microsoft Azure and Visual Studio Team Services, Azure’s integrated suite of DevOps services.
MTTD vs. MTTF vs. MTBF vs. MTTR
Development and operations (DevOps) teams must measure their day-to-day progress. Otherwise, these teams won’t know how they are performing at a given moment. Worst of all, DevOps teams that lack data-driven insights risk falling behind, missing service-level agreement (SLA) requirements and encountering various service problems that could put a company, its employees and its customers in danger.
Uptime and Response Time Graphs
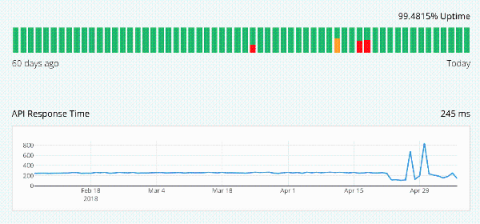
As one of the most requested features we are happy to officially introduce the Uptime and Response time graphs. Setting up an uptime graph requires zero configuration, it’ll be added automatically to your status page (for startup & business subscribers) and you can choose to hide it in the design page of your admin panel.
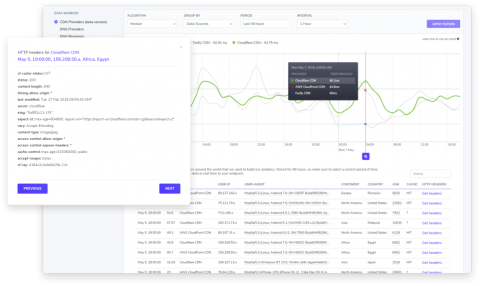
New feature: RUM Raw Logs
Today PerfOps is releasing a new unique feature that allows users to analyze our performance data in even more detail! From now on, you will be able to access the raw logs for all of our HTTP benchmarks. Every single data point that we used to build our charts is available for everyone, along with the full metadata.


