Mailchimp
Not subscribed to OpsMatters Newsletter


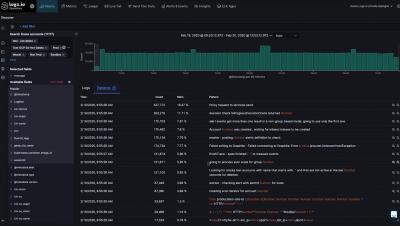
In the previous post in this series, we dug into the data you should track so you can properly monitor your Kubernetes cluster. Next, you will learn how you can start inspecting your Kubernetes metrics and logs using free, open source tools. In this post we’ll cover several ways of retrieving and viewing observability data from your Kubernetes cluster.
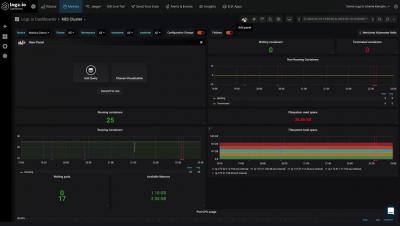
If you’ve read Part 3 of this series, you’ve learned how you can use different Kubernetes commands and add-ons to spot-check the health and resource usage of Kubernetes cluster objects. In this post we’ll show you how you can get more comprehensive visibility into your cluster by collecting all your telemetry data in one place and tracking it over time.
Elixir 1.10 was recently released, and with that release came a little-known, but very interesting feature—compiler tracing. This feature means that as the Elixir compiler is compiling your code, it can emit messages whenever certain kinds of things are compiled. This ability to know what’s going on when Elixir is compiling our code might seem simple, but it actually opens up a lot of doors for opportunities to build customized compile-time tooling for Elixir applications.
Big ideas need creative solutions. Creative solutions mean solving out of the box engineering problems. When you’re solving these new problems, strong error monitoring is imperative to the development cycle. You don’t want to spend all your time chasing down issues and struggling to track the source of errors.
You’re done setting up your first graph panels. You want to do more, look around the visualization settings, and discover the settings for the X and Y axes. You stumble over the configuration for a “Right Y” axis. You ask yourself, “Why on earth would I need another Y axis?” You toggle it back and forth and change some settings, yet that makes no difference to your graph. What gives? Never fear.