Mailchimp
Not subscribed to OpsMatters Newsletter


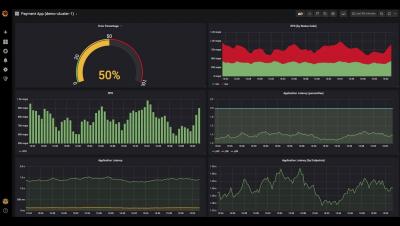
In this blog, we explain how we enable high availability Prometheus using Cortex and Cassandra. This provides a single pane of view across multiple clusters - which enables visualising all monitoring metrics in one go.
When considering the state of critical incidents in 2019 – it’s no surprise that looking ahead to 2020, CISOs have one of the organization’s most challenging and stressful jobs. During the first half of the year alone 4.1 billion records were compromised, and the average cost of a data breach is now estimated at $3.92 million.
Whether you sat out this KubeCon or were too busy working the hallway track to make it to all the sessions on your list, never fear. You can catch up on all the talks given by Grafanistas here.
Real User Monitoring, or RUM, is about measuring the user experience. Not what the user is doing, but what is happening to the user. How is your server performing when the user is making a request? This hidden metric is part of the user’s overall motivation. After all, we all know the frustration of a slow moving website.
In this post, we’ll explore how to create Ruby modules that are configurable by users of our code — a pattern that allows gem authors to add more flexibility to their libraries. Most Ruby developers are familiar with using modules to share behavior. After all, this is one of their main use cases, according to the documentation.