Operations | Monitoring | ITSM | DevOps | Cloud

APM

The latest News and Information on Application Performance Monitoring and related technologies.

Performance Ratings and Experience Scores for Meaningful Alerting and Rapid Observability

Administrators and IT management are increasingly leveraging simple quantifiable KPI indicators such as “Performance Ratings” to gain rapid overviews and track key outcomes. Modern IT architectures are designed and built to scale and be resilient. Systems are now usually built to handle failover and auto-scale up and down to handle varying demand and workloads with very different properties and needs.

Key metrics for application performance monitoring

High availability and flawless performance of business applications are vital to maintaining a company’s online reputation and keeping its customers satisfied. If a business-critical application crashes, frustrated users may abandon the service, leading to a loss in brand value and revenue. Internal business application performance issues can also cause a drop in employee productivity. To prevent these performance issues, enterprises turn to application performance monitoring solutions.

How to ensure HTTP notification delivery

Rely on AppDynamics alerts but consider no alerting system is immune from failure itself. Just like how a power outage could prevent an alarm clock from alerting you at the expected set time, issues can lead to alert failures if say for example, there is a misconfiguration during the setup or perhaps if an endpoint or gateway communication goes offline. Being able to rely on alerts is necessary, expecting one when a system is experiencing a health-related issue, however, we must prepare that there could be a failed HTTP request, that you must rely on that would notify you of an issue.

ChatGPT and Elasticsearch: APM instrumentation, performance, and cost analysis

In a previous blog post, we built a small Python application that queries Elasticsearch using a mix of vector search and BM25 to help find the most relevant results in a proprietary data set. The top hit is then passed to OpenAI, which answers the question for us. In this blog, we will instrument a Python application that uses OpenAI and analyze its performance, as well as the cost to run the application.

AWS ECS Monitoring | Breaking out of the observability vendor lock-in with SigNoz

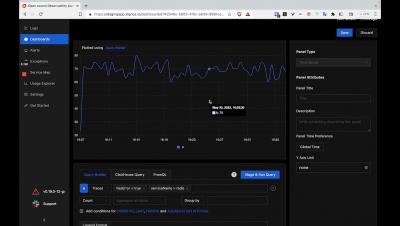
In the not-too-distant past, the debate was between on-prem and cloud-native. You’re now faced with the choice of choosing between the different cloud infrastructure providers, and inevitably, someone will throw in the phrase “vendor lock-in”. And not having a response for the famed “vendor-lockin” sometimes leads to building things that are much more complex than required basis the stage that the product is in.

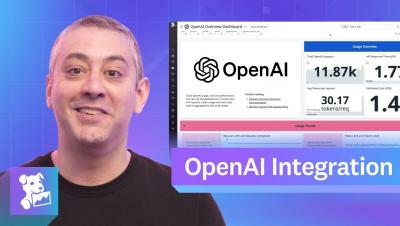
This Month in Datadog: Data Streams Monitoring, OpenAI Integration, CoScreen V5, and more

Datadog is constantly elevating the approach to cloud monitoring and security. This Month in Datadog updates you on our newest product features, announcements, resources, and events. This month, we put the Spotlight on Data Streams Monitoring..

How APM solutions enhance JMeter load testing visibility - Bridging the gap!

As an SRE and DevOps evangelist, I talk to many customers and prospects, most of whom run load and stress testing as part of their application delivery chain, often using JMeter for load testing. Many of them have a misconception: “I have JMeter and I am all set from a performance/ scalability perspective. I don’t need any other tools”.

Datadog vs. New Relic: Which One Is Better [2023 Comparison]

Choosing an excellent application performance monitoring tool is a challenging task. Nowadays, there are dozens of instruments, and it can be problematic to pick the right one. However, when looking into every given “top ten list”, New Relic vs. Datadog will always be there. At this point, instead of focusing on dozens of log management tools, let’s focus on some key ones. Comparing New Relic vs. Datadog offers a distinct perspective on how infrastructure monitoring should look.

Core Web Vitals update: Adjustments to LCP (and INP)

Google has shared small but important adjustments to the way LCP is assessed. LCP, or Largest Contentful Paint, measures how quickly a page appears to load from the user’s perspective. More specifically, this is the time for the main content to be painted or the “render time of the largest image or text block visible within the viewport”. You’ll get a “Good” score when the load time of this content is 2.5 seconds or less.