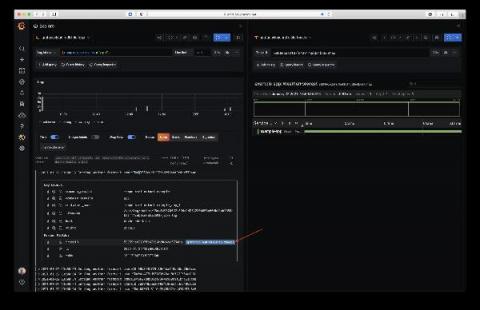
OpenTelemetry is a CNCF project that standardizes observability (logs, metrics, and traces) across many languages and tools. Today we will look at how we can use the OpenTelemetry .NET library to instrument a .NET 5.0 web API, to offload traces to Tempo and logs to Loki in Grafana Cloud. Grafana Cloud now has a free plan. Set up your account and follow along!
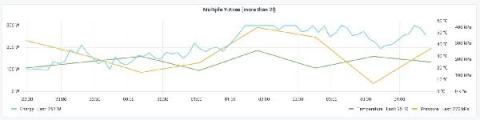
In Grafana 7.0, we introduced a new panel architecture to enhance the UX and visualization options and create a more consistent experience across Grafana. In Grafana 7.4, we expanded on that foundation and introduced the next-generation graph panel called Time series panel, which is currently in beta. The Time series panel uses the panel architecture of Grafana 7.0 and integrates with field options, overrides, and transformations.
Successful businesses don’t sort data — they shape it. Discover, Sentry’s query builder, gives form to your event data so you can measure performance and trace issues across all your projects. Here’s how.
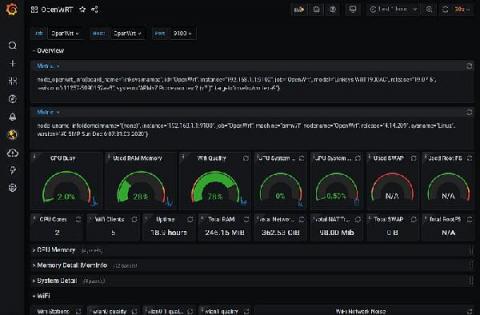
I’ve been an open source fan and user for many, many years, going back to before we defined the term “open source” and we called it “free software.” Whenever and wherever possible I prefer to have control over the software I run on my devices. Case in point: My internet router runs OpenWrt, which is a free/open source Linux operating system designed to replace the software provided by the router’s manufacturer.
Grafana v7.4 has been released! The big news for Grafana 7.4 is the next-generation graph panel called time series, which is in beta. A high-performance visualization based on the uPlot library, it uses the new panel architecture introduced in Grafana 7.0 and integrates with field options, overrides, and transformations.
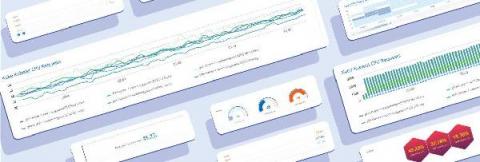
Are you suffering from overspending in Azure, lack of cost visibility and lack of context? You’re not alone; Azure cost management is a problem we hear about time and time again. That is why we created top-notch cost tiles that would allow users to build the perfect Azure cost dashboard, and help them quickly identify overspends and expensive resources in their Azure tenant.
As one of the three pillars of observability, along with logs and traces, digesting metrics is a crucial part of any ITOps admins’ job. Metrics are a numeric representation of data measured over intervals of time and thus can derive knowledge of system behavior historically, which can help predict future patterns of behavior and inform investigations of issues and incidents.
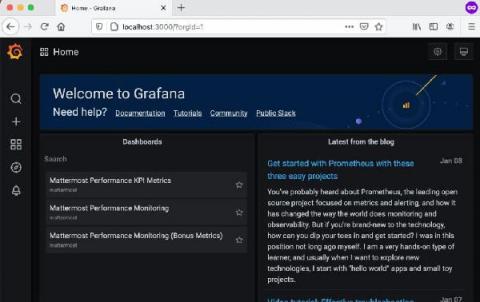
Our Makefile entry point for developing against the Mattermost Server already tries to simplify things for developers as much as possible. For example, when invoking make run-server, this build tooling takes care of all of the following (among other things!).