Operations | Monitoring | ITSM | DevOps | Cloud

Incident Management

The latest News and Information on Incident Management, On-Call, Incident Response and related technologies.

Monthly Moo | April 2022

We are well into 2022 and are busy bringing new exciting features to market. Our customers continue to provide input into our product roadmap and many new features are based on this collaborative effort. A big thank you to our valued customers. Throughout the year we will continue to drive innovation and allow our customers, of all sizes, to implement the most advanced AIOps solution in the shortest time possible.

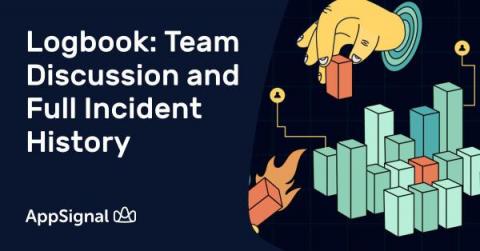
Logbook: Team Discussion and Full Incident History

We've launched a feature that will help you fix errors and performance issues as a team! 🎉 With Logbook you get the full incident history. Read and leave team comments, see which notifications were sent at what time, and see team activity for changes in incident states. It's now easier than ever to see what the current state of an incident is.

Get more from your Jira integration with custom field support

When FireHydrant originally launched our Jira Cloud and Jira Server integrations, we did not support custom fields. This prevented customers who rely on Jira epic ticket types or other custom required fields from getting full value from our Jira integrations. That has changed with the launch of Jira custom field support. We now support the most common type of Jira epic tickets and field-level mapping of Jira custom fields with FireHydrant incident data.

mooving to... Practical Post-Mortems | Thomas Duran, Senior Manager of Productivity, from Panther

Post-mortems are a common practice amongst many organizations, but not everyone knows how to make the most out of an incident. Thomas Duran, Senior Manager of Productivity, from Panther joins us to discuss how to leverage post-mortems to effectively learn from failure.

Jira Integrations with Blameless platform

In this video, our Solutions Engineer walks you through the steps of creating Jira tickets and follow up actions in Blameless. You'll learn how to leverage our Slack integration for quick ticket creation and also how to create tickets from within the Blameless platform. You'll also see how closing a ticket in Jira will automatically close a ticket in Blameless. Additionally, you'll discover how to manage open tickets and incidents in an organized Blameless dashboard.

Service dependencies help you instantly discover all services impacted by an incident

When an incident happens, most organizations have a way of identifying all affected services. The trouble is, it’s often a human-centered process that depends on the knowledge of key individuals or manually updated documentation. There might be a version in your alerting tool, a version in your corporate Wiki, and a different version still in your team’s head.

Collaboratively author retrospectives with our new Google Docs integration

When it comes to learning from incidents, your tools should adapt to the way your organization works. Many of you conduct your retrospectives in rich-text document editing tools, like Google Docs. That’s why we’ve introduced the option to export your retrospectives to Google Docs. Retrospective export to Google Docs can be automated as part of your incident management process with a Runbook step.

Continuous Availability vs. Continuous Change

All companies are going through some form of cloud adoption - whether cloud migration for the first time, hybrid cloud adoption, or extending cloud-native with newer microservice architecture. But, according to a recent survey by Aptum*, only 39% of companies are completely satisfied with their current rate of digital transformation. Cloud adoption projects create a continuous state of change for engineering teams juggling to keep things up and running while limiting the impact on customers.

Sponsored Post

Infrastructure monitoring using kube-prometheus operator

Prometheus has emerged as the de-facto open source standard for monitoring Kubernetes implementations. In this tutorial, Kristijan Mitevski shows how infrastructure monitoring can be done using kube-prometheus operator. The blog also covers how the Prometheus Alertmanager cluster can be used to route alerts to Slack using webhooks. In this tutorial by Squadcast, you will learn how to install and configure infrastructure monitoring for your Kubernetes cluster using the kube-prometheus operator, displaying metrics with Grafana, and configuring alerting with Alertmanager.