The latest News and Information on Monitoring for Websites, Applications, APIs, Infrastructure, and other technologies.
The Grafana Agent team is happy to announce that Grafana Agent 0.14.0-rc2 includes improved Windows support. Up until now, running Grafana Agent — our tool for gathering metrics, logs, and traces — in Windows was difficult and not well supported for Windows best practices. In short, it was not a good Windows citizen. In the new release candidate, we’re making changes to improve the experience, based on feedback from GitHub issues, customer contacts, and our own experience.
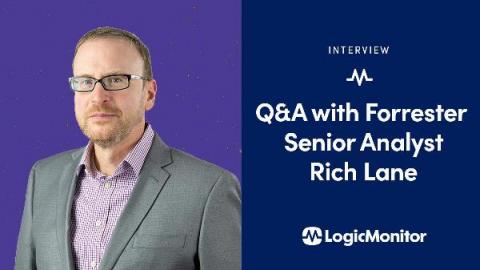
I recently had the honor of moderating a webinar featuring Forrester Senior Analyst Rich Lane and Steve Breen, Head of Managed Services at ANS, titled “AIOps for the Modern Enterprise: Real-World Advice & Implementation Tips from the Pros.” In this informative session, Rich and Steve talked about the importance of building AI and automation into business strategy and provided tips, tricks, and real-life examples of how modern organizations are using AIOps to drive positive business outc
Continuous monitoring (CM), also referred to continuous control monitoring (CCM), is an automated process that allows DevOps teams to detect compliance and security threats in their software development lifecycle and infrastructure. Traditionally, businesses have relied on periodic manual or computer-assisted assessments to provide snapshots of the overall health of their IT environment.
In an earlier blog, we had discussed what is Microsoft Windows Virtual Desktop (WVD) and why it is gaining popularity. In this blog, we present various community and vendor resources that can help you choose the right Azure instances for your Microsoft WVD deployment. Here, at eG Innovations, we offer a wealth of monitoring and simulation tools to allow you to monitor what real users are experiencing when accessing Microsoft WVD.
A typical service delivery chain starts from the device and runs through the network and all the way through to the application. There are many things that can go wrong along the way! It’s critical to monitor that experience and quickly understand where issues occur, why they occur, and what can be done to remedy them. That’s where employee and/or customer Digital Experience Monitoring (DEM) comes into play.
Pandora FMS is a proactive, advanced, flexible and easy-to-configure monitoring tool according to each business. Pandora FMS integrates with the needs of the business, being able to monitor servers, network equipment, terminals and whatever is necessary. In this article we will focus on monitoring using Pandora FMS, bearing in mind the new reality, which has arrived to stay, known as “Digital Transformation”.