The latest News and Information on Monitoring for Websites, Applications, APIs, Infrastructure, and other technologies.
Without Network Monitoring, there is no good way to get a real-time view of your connected environment. But with Network Monitoring reports, you can look backwards to spot problems and trends. Just as vital are logs that deepen this rear-view mirror look, as they contain all the data for all the elements you are monitoring.
A logging framework is a software tool that helps developers output diagnostic information during the execution of a program. This information is used to debug the program or monitor its performance. There are many different logging frameworks available, starting with simple logging libraries to full-fledged logging and observability platforms.
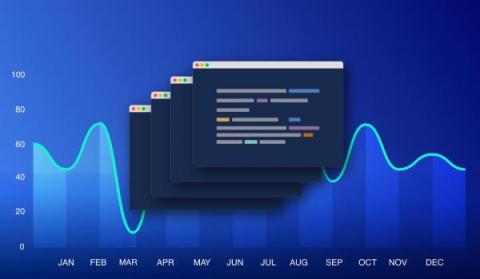
Back in my day, our offices used to have an “open concept” layout – just rows of desks. And at the end of every row was a 720i LCD TV showing 4 to 5 key metrics we’d watch after every release with great concern. While those wallboards sure were beautiful, we rarely had a clear view on how a release was trending. With our latest update to Dashboards, we’re joining form and function with Release Health widgets and a new release filter.
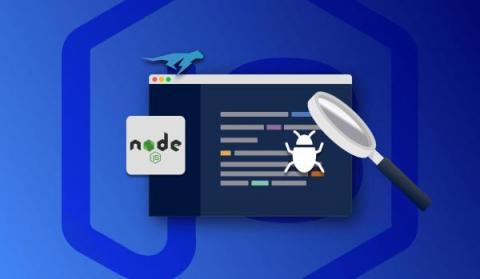
HTTP is the backbone of all API-centric, modern web apps. APIs are the place where the core business logic of an application lives. As a result, developers spend a lot of time optimizing the API business logic. This article addresses a Node.js developer’s dilemma while debugging an HTTP API request. We take a sample Node.js/Express.js-based HTTP service to demonstrate a new way of debugging Node.js applications using the Lightrun observability platform.
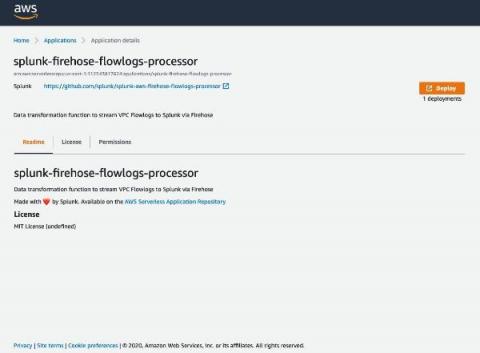
Amazon Web Services (AWS) recently announced the ability to publish VPC Flow Logs directly to Amazon Kinesis Data Firehose. For Splunk customers, this feature helps to optimize the architecture to send VPC Flow Logs directly to Splunk Enterprise or Splunk Cloud Platform. With a fully managed service like Amazon Kinesis Data Firehose, users don’t have to worry about scaling, and can optionally transform their data in near real-time and enjoy the cost-effective, reliable service.
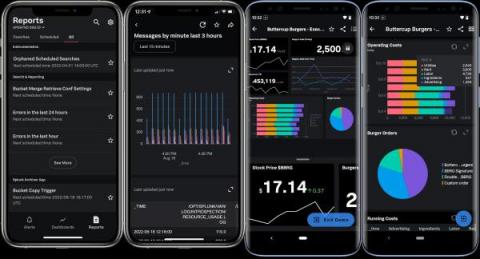
Hot summer days mean beautiful weather for picnics, pool days, and trips with the family. While you’re out this summer enjoying the sun, leave your laptop and backpack behind, because with Splunk Mobile, you’ll always be ready to access dashboards or receive alerts no matter where you are. The new features announced this year at.conf22 let you do even more from the comfort of your pool chaise!
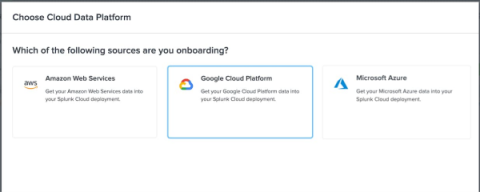
I'm excited to announce that Splunk Data Manager now supports onboarding of Google Cloud Platform (GCP) data sources, effective immediately. With this launch, you can now get the benefits of Splunk data analysis for the high-value events generated by Google Cloud when you onboard GCP data sources into Splunk using Data Manager.