Operations | Monitoring | ITSM | DevOps | Cloud

The latest News and Information on Monitoring for Websites, Applications, APIs, Infrastructure, and other technologies.

Pingdom & Custom Metrics now on Statuspal

We’re happy to announce the general availability of Pingdom & custom metrics on Statuspal. This means that your are now able to configure two new types on metrics (on top of monitored service metrics), metrics coming from your Pingdom account and metrics that you can manually push periodically, both types of metrics will look similar in your status page. Example Pingom metrics chart You should be able to find a new menu “Metrics” under your status page’s dashboard.

Adding tests through the StatusCake API with Postman

Recently we’ve had a lot of requests for examples of how add new tests through the StatusCake API using the popular Postman tool. In this article we’ll take you through some of the steps required to get you going with this method, below you’ll find an example for each test type we offer, taking you through the process of adding a test.

Monitoring DNS Records for Wildcard Values

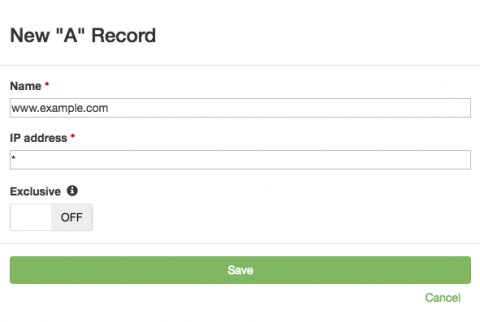
Back in 2016, we added support for monitoring wildcard DNS records. Wildcard DNS records are used to serve requests for otherwise non-existent domain names. Today we’re pleased to announce that we’ve extended our support for using wildcards in DNS records monitoring. DNS Check now allows you to specify a wildcard (*) in place of some DNS record values, such as an A record’s IP address to indicate that any value is acceptable, but the record must exist.

Kubernetes Monitoring with Prometheus -The ultimate guide (part 1).

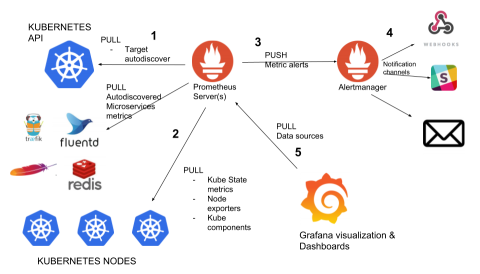
Prometheus monitoring is fast becoming one of the Docker and Kubernetes monitoring tool to use. This guide explains how to implement Kubernetes monitoring with Prometheus. You will learn how to deploy Prometheus server, metrics exporters, setup kube-state-metrics, pull, scrape and collect metrics, configure alerts with Alertmanager and dashboards with Grafana.

Introducing the Service Map in Datadog

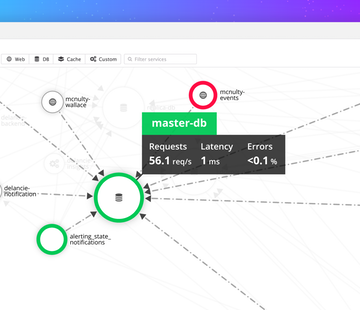
When your pager goes off at 3:00 a.m. and you need to begin your investigation, where do you start? Before you can attack the problem, you need to know the lay of the land: What else is potentially affected by this failing service? What are its dependencies? Where are the probable root causes? With the new Datadog Service Map, you can visualize the topology of your application to answer these questions and more.

Feature Spotlight: Email Server Checks

Because email is communication is prevalent in today’s business landscape, use Uptime.com’s email server checks to continually monitor email server status. Let’s get familiar with the three different types of email checks you can implement. Simple Mail Transfer Protocol (SMTP) checks monitor the flow of email across the Internet.

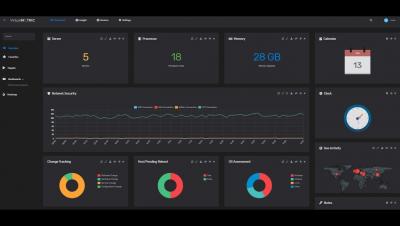
The New VirtualMetric Infrastructure Monitoring Suite - Evolved Dashboard and Exceptional UX-

VirtualMetric's team is presenting an Exclusive Closed Webinar - The New VirtualMetric - Evolved Dashboard and Exceptional UX. During the past months, we have put in all efforts to improve our infrastructure, server and virtualization monitoring and tracking solution and create outstanding experience and functionalities for our customers. Now, we want to share all the changes and improvements with you!

Is Citrix Director Sufficient for End-to-End Monitoring of Citrix Workspace Environments?

In a previous post, we discussed the capabilities and functionalities of Citrix Director, a built-in monitoring tool that is available as a part of Citrix XenApp and XenDesktop deployments. While Citrix Director provides high-level analytics about user sessions, user logon information and logon time breakdowns, connection failures, etc., is it designed to be the end-to-end, single-pane-of-glass performance management solution for Citrix Workspace environments?

Creating a Chrome extension in 2018: The good, the bad and the meh

Last week, we shipped an initial version of Puppeteer Recorder, a Google Chrome extension that records your browser interactions and generates a Puppeteer script. It turns out Chrome extension development is almost like real web development, but with a weird dash of quasi embedded development mixed in. This post talks you through the development lifecycle when creating an extension and lists some of the architectural gotcha’s. Source code for the extension in question is on github.