Operations | Monitoring | ITSM | DevOps | Cloud

The latest News and Information on Monitoring for Websites, Applications, APIs, Infrastructure, and other technologies.

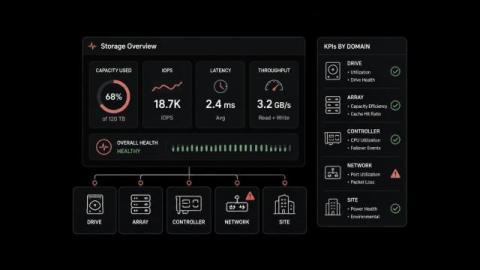
Storage Monitoring Tools and the KPIs Behind Each Failure Domain

When an application slows down, how long does it take to confirm whether storage caused it? The answer depends entirely on whether anything is collecting from the array itself. The server dashboard reports healthy CPU and memory, the network graphs look clean, and the array holding the data says nothing at all. Storage failures announce themselves late.
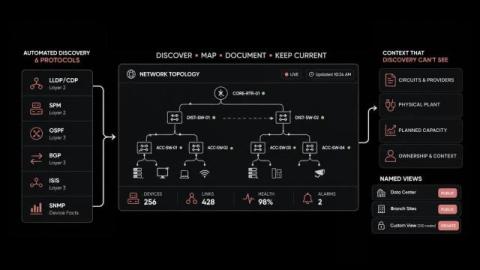

How Network Documentation Software Keeps Network Diagrams Current

When did anyone last open your network diagram and trust what it showed? A diagram drawn in a static drawing tool is accurate on the day it is saved. One quarter, two circuit upgrades and a hardware refresh later, it describes a network that no longer exists. Nothing warns you that this has happened. The file still opens, still prints, and still gets attached to change requests, which is what makes it risky during an incident.

Recurring Office Hours with the AI SRE Agent Team Behind AURA

Building an agent and not sure how to approach something? Bring it. AURA office hours are recurring working sessions with the people who build it. The team has been talking to people trying out AURA and hearing the same good questions come up more than once. Office hours are the answer to that: a standing slot on a schedule, rather than one conversation at a time. The format is deliberately loose. Nobody is arriving with thirty slides to spend an hour talking at you. The session goes wherever the questions go.

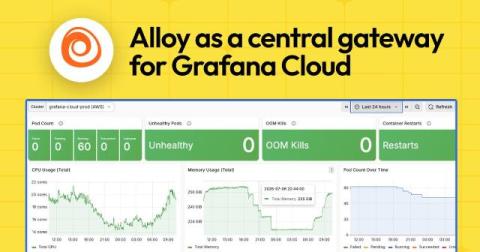
How to scale Alloy as a central telemetry gateway: capacity planning, load testing, and production lessons

Running Alloy as a single-instance sidecar is simple. Running it as a centralized gateway that absorbs the full telemetry stream of an enterprise platform—tens of millions of active series, terabytes of logs per day, and tens of thousands of trace spans per second—is a different challenge altogether. To get it right, you need deliberate capacity planning, honest load testing, and a monitoring setup that doesn't rely on the very thing you're testing.

Control trace volume with OpenTelemetry tail-based sampling

OpenTelemetry (OTel) tail-based sampling helps teams control trace volume by retaining errors, slow requests, and other traces worth investigating while dropping lower-value traffic. In distributed systems, a single request can fan out across many services, each emitting spans. That volume adds up quickly. Some applications produce millions of traces per hour, while large clusters generate more than 10 billion spans per day.

GitHub outage on August 17, 2026: seven hours of Unicorn errors and Copilot failures

GitHub was hit by a major global outage on August 17, 2026 that began with its infamous “Unicorn” error page and ended with a long tail of Copilot failures, lasting about seven and a half hours in total. StatusGator sent an Early Warning Signal at 13:35 UTC, five minutes before GitHub confirmed the incident on its status page at 13:40 UTC. User reports kept flowing until 20:12 UTC, well after the main site had recovered, because Copilot stayed broken for hours.
Sponsored Post

Connecting Ticketing Systems to Microsoft SCOM

As enterprises continue to modernize their IT operations, integrating Microsoft System Center Operations Manager (SCOM) with ticketing and IT service management (ITSM) platforms has become essential for reducing alert noise, improving incident response, and streamlining operations. This whitepaper provides a comprehensive overview of available integration options, categorized by complexity and supported features. It also highlights common challenges, best practices, and strategic recommendations for selecting and maintaining an effective integration architecture.

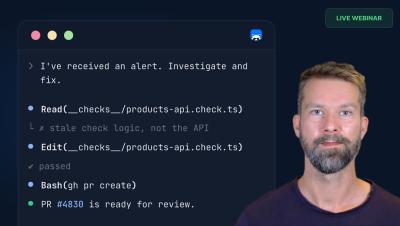
Let AI Agents Own Your Monitoring: From Setup to Auto-Fixed Incidents

Your AI agent can set up your monitoring, report on platform health, and open a PR to fix a failing check. All this works automatically. In this webinar, Stefan (Developer Relations at Checkly, Google Developer Expert & Playwright Ambassador) demonstrates how Monitoring as Code makes Checkly agent-friendly by design, and walks through three agentic workflows live.

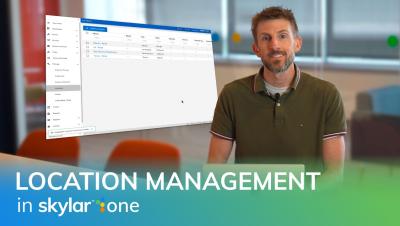
Location Management in Skylar One

Location Management in Skylar One gives IT teams a centralized way to create, maintain, and organize location data, building the foundation for trusted geographic visibility across distributed environments. In this walkthrough, Brian Harding, Director of Product Management at ScienceLogic, demonstrates how to create and manage locations in Skylar One. See how teams can define locations, associate them with the right organizations, and use accurate latitude and longitude data to establish the geographic context needed for devices, services, and Geographic Maps.