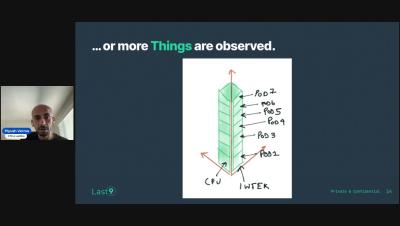
Webinar: Uncovering High Cardinality with Piyush Verma
We discussed why high cardinality matters, how it increases, and how current metrics monitoring solutions need a different way of looking at the problem.


The latest News and Information on Monitoring for Websites, Applications, APIs, Infrastructure, and other technologies.
The Grafana Loki GitHub repository just hit 20K stars! You can’t exchange GitHub stars for coffee at Starbucks or pay rent with it, but this is a big milestone that is a testament to the enormous momentum of this open source project. Thank you to the Grafana Loki community — this couldn’t have been possible without you! To celebrate this 20K benchmark, here are 20 completely random, but fun facts and tips about Grafana Loki: Interested in learning more about logging?
In this livestream, Cribl’s Ahmed Kira and I go into more detail about the Cribl Stream Reference Architecture, with a focus on scaling syslog. They share a few use cases, some guidelines for handling high-volume UDP and TCP syslog traffic, and talk about the pros and cons of some of the different approaches to tackling this challenge. It’s also available on our podcast feed if you want to listen on the go.
CloudWatch and Sentry are two powerful tools that play crucial roles in monitoring and error tracking, making them essential for any organization that wants to ensure the smooth operation of its applications and systems. CloudWatch, developed by Amazon Web Services (AWS), offers comprehensive monitoring capabilities for AWS resources and applications, providing real-time insights into system performance and resource utilization.
Today's fast-paced digital landscape demands efficient and reliable web hosting solutions. As websites and applications become increasingly complex, businesses are constantly seeking ways to optimize their performance and ensure seamless user experiences. One crucial aspect of this optimization process is the effective monitoring and tracking of vital metrics.
InfluxData and Dremio have always been at the forefront of embracing open source solutions to enhance their product offerings. This post discusses how both companies currently leverage the Apache Ecosystem and describes the downstream impact these powerful technologies have on their offerings. InfluxData created and maintains InfluxDB, a time series platform.
Not sure which performance metric to use to measure your application performance? Don’t worry – you’re not alone. With a wide variety of options, the task of choosing the right metric can be daunting. This post will help you decide which metric is right for your monitoring needs by discussing the strengths and limitations of each metric.