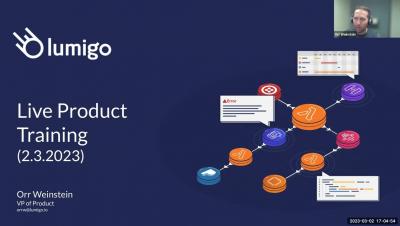
Lumigo Live Product Training #1
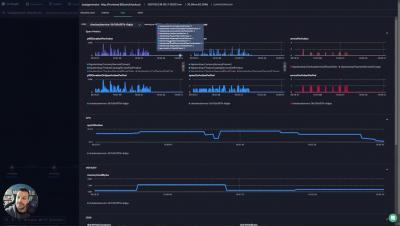
Watch Lumigo VP of Product cover some best practices for troubleshooting microservice applications with Lumigo. Make sure to subscribe so you don't miss out on any new livestreams and observability content! With one-click distributed tracing, Lumigo lets developers effortlessly find and fix issues in serverless and containerized environments.