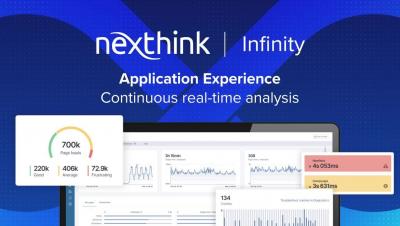
Operations | Monitoring | ITSM | DevOps | Cloud

The latest News and Information on Monitoring for Websites, Applications, APIs, Infrastructure, and other technologies.

Employee Engagement: Product Overview

Learn how Nexthink Infinity bridges the gap with contextual two-way communications, cutting through the digital workplace noise with attention-grabbing notifications that employees respond to. Don’t waste time chasing down employees who ignore emails. Instead, provide critical information, share a survey, or help them fix issues automatically to improve their experience and productivity with Nexthink Employee Engagement.

Managing your Kubernetes cluster with Elastic Observability

As an operations engineer (SRE, IT manager, DevOps), you’re always struggling with how to manage technology and data sprawl. Kubernetes is becoming increasingly pervasive and a majority of these deployments will be in Amazon Elastic Kubernetes Service (EKS), Google Kubernetes Engine (GKE), or Azure Kubernetes Service (AKS). Some of you may be on a single cloud while others will have the added burden of managing clusters on multiple Kubernetes cloud services.

Kentik Market Intelligence just increased its IQ - introducing KMI Insights!

Early this year we launched Kentik Market Intelligence (KMI). If you missed it, KMI enumerates transit and peering relationships as well as produces rankings based on the volume of IP space transited by ASes in different geographies. Using tables and charts, KMI offers a global view of the internet out-of-the-box without any configuration or setup. KMI uses public BGP routing data to rank ASes based on their advertised IP space.

Watch Grafana Labs CEO, Co-founder Raj Dutt discuss why companies need observability

Grafana Labs CEO and Co-founder Raj Dutt sat down with “NYSE Floor Talk” ahead of ObservabilityCON to discuss why companies are increasingly focused on observability as a means to improve customer satisfaction. In his conversation with Judy Khan Shaw, host of “NYSE Floor Talk,” Dutt also talked about Grafana Labs’ big tent philosophy and the growth of Grafana Labs and the Grafana open source community.

Set up Performance Monitoring With Tonal

We’re drowning in dashboards with no clues or clear steps to help us take action on our app’s performance. But as our eyes glaze over, we’re missing bugs and slowdowns sometimes weeks too late. Join our interactive co-working session with Max Lapides, Senior Manager of Mobile Software Engineering at Tonal, and learn how to customize performance monitoring in real time with our latest product updates.