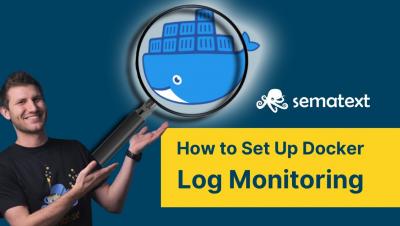
The latest News and Information on Monitoring for Websites, Applications, APIs, Infrastructure, and other technologies.
Let’s start with a concept you’re probably familiar with: how it feels to get into a flow state at work. Maybe you were creating a new graphics package for a client deliverable. Maybe you were building a new website, or working on a coding sprint for the next product release. Maybe you were digging into some script automations for common technical issues. It doesn’t really matter what you were doing; what’s really important is how you felt while you were doing it.
In May, a team from Grafana Labs descended on Valencia, Spain, to share their latest insights on the cloud native landscape at KubeCon + CloudNativeCon EU 2022. Along with diving into the future of Kubernetes monitoring with kubectl alpha events and multi-cloud deployments, Grafanistas presented an overview of the Prometheus ecosystem with an eye towards how sparse high-resolution histograms are going to change the game.
96% of companies now use or are in the process of evaluating Kubernetes. As the maturity and complexity of Kubernetes environments grow, costs quickly spiral out of control when an effective strategy for visibility and optimization is not in place.
Kentik Synthetics is all about proactive monitoring. With synthetic monitoring, you can investigate users’ digital experience by peeling back, layer by layer, exactly what’s going on in every aspect of the digital experience from the network layer all the way to application. Because synthetic tests can be so granular, the results provide different information than you can get from flows, streaming telemetry or other observability data.
The invention of computers gave us the promise of high speed, a new user experience, and extreme reliability. Early research by Robert B. Miller, who helped design some of the earliest IBM computers, discussed the transactions between humans and computers. Miller believed users require a response from a machine within two seconds to maintain their concentration and productivity.
Synthetic monitoring tools have long formed a core part of application performance management and monitoring toolsets. Yet no matter how familiar you are with synthetic monitoring, there is likely room to get more out of it than you currently are. Indeed, the default approach to synthetic monitoring tends to involve using it reactively: problems occur in production, and your team uses synthetic monitoring to help understand and remediate them.