Operations | Monitoring | ITSM | DevOps | Cloud

The latest News and Information on Monitoring for Websites, Applications, APIs, Infrastructure, and other technologies.

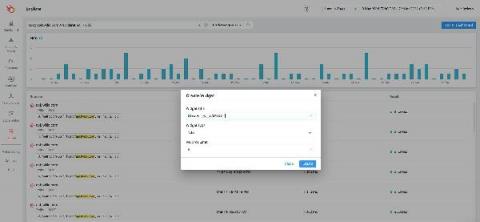
Tutorial | How to use LogDNA Screens

Use LogDNA Screens to display daily log activity from all of your systems or select systems. Use time-shifted graphs to aggregate data from the previous week to compare activity levels in your current week. Our screens let you create an easy-to-read dashboard containing widgets that convey metrics from your logs. These include graphs, gauges, tables, and time-shifted graphs. In this video, we'll create a screen with widgets that provide different views of your webserver's 404s.

Aggregating Application Logs From EKS on Fargate

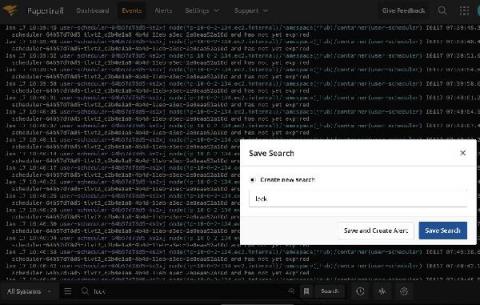
Today we’re going to talk about logging with Kubernetes on AWS using CloudWatch and SolarWinds® Papertrail™. We’ll cover setting up Papertrail, installing and configuring the rKubeLog package, viewing the logs in the Papertrail event viewer, and cross-checking those logs with the ones we see with kubectl. From there, we’ll set up a few different alerts.

What Does Server Monitoring Mean in 2021? A Look at Modern Server Options and How to Monitor Them

A few years ago, monitoring was simple. We had all our servers somewhere in the data center; we just had to install a monitoring tool and gather all the data from every server. Things changed when we started moving to the cloud and then to containers. Today, we often need to monitor a variety of different sources. A “server” can be a physical machine, virtual machine, container, or even a serverless application. Therefore, our approach for monitoring needs to change.

2021 Hybrid Cloud Predictions: CEO Perspective

COVID-19 certainly accelerated some trends. For example, in my view, COVID-19 accelerated the pace and progress of digital transformation by five to 10 years, as companies faced the need to adapt to a post-COVID-19 world, involving permanently the higher adoption of remote work, remote education, and digital touch-points. Technologies requiring less human touch and more digital touch-points will be adopted faster in the aftermath of COVID-19.

How to handle monitoring as a solo founder

When you're a single person running a system with thousands of users or more, it can be pretty daunting to think about going on holiday, or even relaxing for a weekend. "What if it goes down, and I'm not there to fix it?!" you ask yourself. While you can never really guarantee that nothing will go wrong, you can take some steps to minimise your risk of things going wrong.

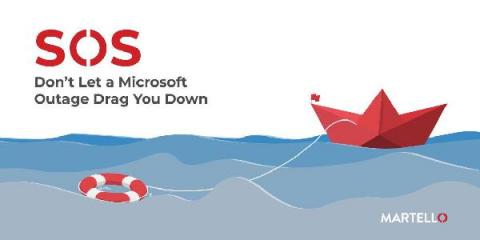
SOS - Don't Let a Microsoft Outage Drag You Down

You are at your desk, when all of a sudden there seems to be a hum that is growing louder, your heart starts to pound and you quickly realize that you might be in the midst of another Microsoft outage. You know that right now, Microsoft is your organization‘s core workforce engine and the backbone to ensure productivity - any outage or decrease in service quality can cause widespread productivity declines.

Now is the time for Sumo!

Sumo Logic transforms an overwhelming volume of data generated from digital services into valuable insights. With Sumo Logic, customers improve how they monitor and troubleshoot applications and infrastructure, manage audit and compliance requirements, detect and resolve security threats, and extract critical, key business indicators to gain insights into customer behavior and engagement.