Operations | Monitoring | ITSM | DevOps | Cloud

Livin' on the Edge With Cribl Edge 4.0: Featuring Improved Scalability, Enhanced Fleet Management, and AppScope Integration

Cribl CEO Clint Sharp first announced Cribl Edge in March of 2022. Our SVP of Marketing, Abby Strong, complemented the announcement with a well-rounded blog post discussing why Cribl Edge is the first fully manageable and auto-configurable agent designed to collect telemetry data at scale. Even Aerosmith gave the product a shoutout! Well, not really, but wouldn’t it be fun if it was true? 🙂 We’re thrilled to be back with exciting news about the latest release of Cribl Edge (4.0).

Grafana Agent 0.29.0 release: New OpenTelemetry components

Today the Grafana Agent team is excited to announce the release of Grafana Agent v0.29.0. This September, we introduced a new way to easily run and configure Grafana Agent called Grafana Agent Flow, our new dynamic configuration runtime built on components. Within Flow, we are also embracing Grafana Labs’ big tent philosophy by introducing OpenTelemetry (OTel) Collector components and converters for traces, metrics, and logs in Agent v0.29.0.

AWS Lambda Telemetry API: Enhanced Observability with Coralogix AWS Lambda Telemetry Exporter

AWS recently introduced a new Lambda Telemetry API giving users the ability to collect logs, metrics, and traces for analysis in AWS services like Cloudwatch or a third-party observability platform like Coralogix. It allows for a simplified and holistic collection of observability data by providing Lambda extensions access to additional events and information related to the Lambda platform.

What to Expect from Flux 1.0

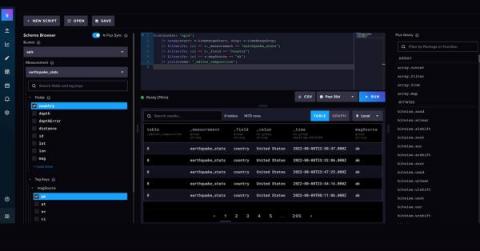
This week at InfluxDays we announced that Flux 1.0 is coming soon. Version 1.0 of Flux lang is a commitment to no longer make breaking changes to the Flux language. Importantly, today’s Flux scripts will work on Flux 1.0, and no breaking changes will be introduced between now and the release of Flux 1.0. Along with version 1.0, we have some features we are also releasing soon. Here are the features we have coming and a short explanation of why you might want to leverage them.

A New Era of Sentry

Today we are releasing Dynamic Sampling, available to all new customers, and opt-in for existing customers. This goes beyond a new feature however and is an overhaul to the way we package Sentry’s Performance Monitoring product. We are saying goodbye to the days of static, magic number sampling configured within the SDK and moving to a world of flexibility.

Announcing Grafana Phlare, the open source database for continuous profiling at massive scale

At ObservabilityCON in New York City today, we announced a new open source backend for continuous profiling data: Grafana Phlare. We are excited to share this horizontally scalable, highly available database with the open source community — along with a new flame graph panel for visualizing profiling data in Grafana — to help you use continuous profiling to understand your application performance and optimize your infrastructure spend.

Introducing Grafana Faro, an open source project for frontend application observability

Today, during the ObservabilityCon 2022 keynote session, we announced a new open source project for frontend application observability, Grafana Faro. The project is launching with a highly configurable web SDK that instruments web applications to capture observability signals. This frontend telemetry can then be correlated with backend and infrastructure data for seamless, full-stack observability. There’s supposed to be a video here, but for some reason there isn’t.