Operations | Monitoring | ITSM | DevOps | Cloud

Blog

A 3-step guide to troubleshooting and visualizing Kubernetes with Grafana Cloud

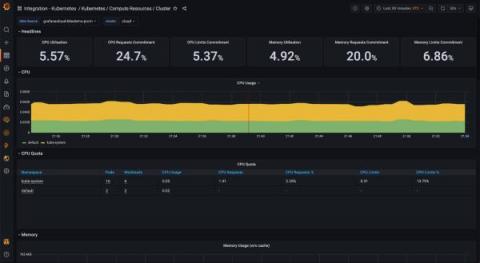
Back in May, we announced the Kubernetes integration to help users easily monitor and alert on core Kubernetes cluster metrics using the Grafana Agent, our lightweight observability data collector optimized for sending metric, log, and trace data to Grafana Cloud. Since then, we’ve made some improvements to help our customers go even further.

7 Things to Check Before Launching a Website

Launching a website is a process that takes numerous essential steps. As the launch date comes closer, the excitement might lead to an oversight here and there. You can prevent this by deploying patience and double-checking every part of your website before it goes live. It all comes down to the type of website you're planning to launch. The more features you're planning to have, the longer the pre-launch inspection is going to take.

Monitor your Synthetic private locations with Datadog

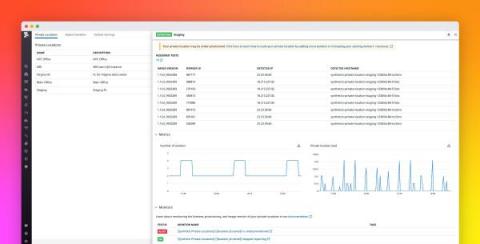
Datadog Synthetic private locations play a key role in your organization’s test infrastructure by serving as highly customizable points of presence (e.g., data centers, geographic locations) for running synthetic tests on internal services. You can deploy private locations using the orchestrator of your choice, enabling you to seamlessly roll them out and scale them with the rest of your container fleet.

Monitor Confluent Cloud with Datadog

Confluent Cloud is a fully managed, cloud-hosted streaming data service. Enterprise customers use Confluent Cloud for real-time event streaming within cloud-scale applications. We’re excited to announce a new integration between Datadog and Confluent Cloud, which enables users to get deep visibility into their Confluent Cloud environment with just a few clicks. In this post, we’ll introduce how to set up the integration and start monitoring key metrics from your clusters.

NECA delivers 99.9% system uptime using Applications Manager

NECA is an allied association of local telecommunications providers in the United States that was instituted by the Federal Communications Commission. It aims to provide rural consumers across the country with telecommunications and broadband services at affordable prices. Its services also include economic forecasting, trend analysis, industry database management, and rate and tariff analysis.

Extend your DevOps analysis to CircleCI and GitLab data

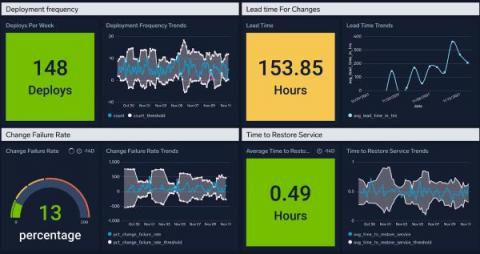
Every company is a software company and every company wants to get better at it. That’s the reason we built Software Development Optimization or SDO. SDO helps you track siloed data across the DevOps toolchain. It normalizes and correlates data, provides you with DORA’s 4 key metrics and gives you deep insights into the velocity and quality of delivery across services and teams.

What does a mature MSP actually look like?

We talk a lot about MSP maturity, but I wanted to take the opportunity in this blog to really consider what that maturity actually looks like. For starters, I believe there are three key areas of excellence that currently define maturity in an MSP business: In all these areas, mature MSPs are constantly tweaking the dial and making ongoing investments.

Detailed Insight, Right on Time: Introducing Scheduled Alerts

Logz.io customers, here’s some big product news that we think you’ll be excited to hear. Scheduled Alerts, an altogether new manner of alerting, is coming your way. That’s right, get ready to utilize a whole new world of alerts that weren’t previously available in the Logz.io platform.

How to connect Puppet Enterprise to Okta using SAML

Nowadays, staff in organizations are required to access multiple applications in their infrastructure. This can lead to the user having to manage multiple login credentials and passwords. There are many solutions available that provide a single sign-on (SSO) capability — such as Okta, LDAP, and Active Directory — which is becoming common practice across businesses.