Operations | Monitoring | ITSM | DevOps | Cloud

May 2019

Logstash Tutorial: How to Get Started

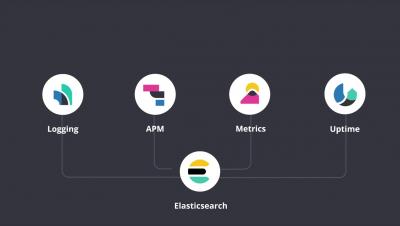
Logstash is the “L” in the ELK Stack — the world’s most popular log analysis platform and is responsible for aggregating data from different sources, processing it, and sending it down the pipeline, usually to be directly indexed in Elasticsearch. Logstash can pull from almost any data source using input plugins, apply a wide variety of data transformations and enhancements using filter plugins, and ship the data to a large number of destinations using output plugins.

Deploying Kafka with the ELK Stack

Logs are unpredictable. Following a production incident, and precisely when you need them the most, logs can suddenly surge and overwhelm your logging infrastructure. To protect Logstash and Elasticsearch against such data bursts, users deploy buffering mechanisms to act as message brokers. Apache Kafka is the most common broker solution deployed together the ELK Stack.

Clearing the Air: What Is Cloud Native?

If you have had any exposure to cloud computing or app development in recent years, you likely have heard the term “cloud native” thrown around. But you might be wondering what exactly that term means, and how it differs from concepts such as “cloud ready” or “cloud enabled.” As a cloud-native service provider, Sumo Logic understands the architecture underpinning this development model. Let’s take a closer look at the cloud-native concept and what it means.

Announcing $52 Million Series D Funding to Unleash the Value of Machine Data and Open-Source

Today I have the immense privilege of sharing the exciting news that we have raised $52M in series D funding led by General Catalyst. I am thrilled that all of our existing investors share our vision and chose to invest further in the company.

An Elasticsearch Tutorial: Getting Started

Elasticsearch is the living heart of what is today’s the most popular log analytics platform — the ELK Stack (Elasticsearch, Logstash and Kibana). The role played by Elasticsearch is so central that it has become synonymous with the name of the stack itself. Used primarily for search and log analysis, Elasticsearch is today one of the most popular database systems available today.

Key Metrics to Baseline Cloud Migration

Cloud computing is well past the emerging stage. It’s no longer a radical idea for businesses to depend on cloud platforms and services to serve as their technology backbone--and the numbers show it. In 2018, Forrester reported that nearly 60% of North American enterprises rely on public cloud platforms. This year, Gartner projects that the public cloud services market will grow from last year’s $182.4 billion to $214.3 billion this year, a 17.5% jump.

New Integration with Slack, Microsoft Teams and Pager Duty

Keep track of your infrastructure and apps from everywhere, and share valuable insights with colleagues. XpoLog 7 log monitoring tool, features new integrations with Slack, PagerDuty, and MS Teams. These integrations come in two levels: Learn more about XpoLog’s proactive log monitoring tool How to share your searches and get alerts via MS Teams, Slack and Pager Duty? More and more users choose to use IM apps around the world, for personal and professional purposes. Global Information Inc.

Top 5 Cloud Security Trends Revealed

Cloud security is becoming one of the most pressing issues for many modern organizations as they move to the cloud. According to Cloudneeti’s 2019 Cloud Security Trends and Predictions report, by 2020, 41% of overall workloads will run in public clouds. Defending against unauthorized data exposure and securing data, applications, and infrastructures across the cloud environment is a must. It is the responsibility of every organization and should be taken seriously.

Grafana Labs at KubeCon: Loki's March Toward GA

At KubeCon + CloudNativeCon EU this week, Grafana Labs VP Product Tom Wilkie gave a talk about Loki, the Prometheus-inspired service that optimizes search, aggregation, and exploration of logs natively in Grafana. In case you missed it, here’s a recap. Wilkie’s talk is an overview of how and why Grafana Labs built Loki and the features and architecture the team built in. Our policy is to develop projects in the open, so the design doc has been publicly accessible since development started.

Keeping it Local: Bringing Logz.io to an AWS Region Near You

At Logz.io we obsess over our customers and believe that our customers’ happiness is fundamental to our success as a company. With a growing number of customers all over the world, it’s important to us that we provide them with the best experience we possibly can. After all, we know we’re handling extremely important data and helping to keep mission-critical applications up and running.

Using Winston 3 for Logging in Node.js

Winston is one of the most popular and versatile logging libraries for Node.js. With Winston, you can differentiate and redirect your logs to different places depending on their severity or purpose, and ensure there are redundant records in case of any failures or corruption later on. With the Winston 3.0 update, one of the biggest changes is the ability to apply custom formatting to your logs.

Recycling is for Cardboard, not Analytics Tools

Recycling is an important part of my family’s weekly chore patterns. Our Amazon deliveries alone generate copious amounts of cardboard for our weekly pickup in the giant blue can. I also find myself trying to think about the longevity of the stuff I buy and try not to be wasteful. I feel a sense of pride. But there is one area where I just don’t think recycling makes sense -- and that’s with software (that’s in addition to underwear and toothbrushes, of course…).

Client-Side Logging with LogDNA

Logging is an essential part of application development, monitoring, and debugging. There are countless libraries, frameworks, and services for logging backend and server-based applications. But for client-side applications, especially JavaScript-based web applications, it’s a different story. As we see increasingly complex code running on end user devices, the need to log these applications is also becoming increasingly important.

How to Search through LogDNA Archives

Retention is a crucial factor in adopting a log management solution. For most organizations, 30 days is a perfect balance between having to access historical log data and the high cost of storage. However, some organizations need to retain logs for a much longer period of time, whether it’s to comply with regulations, perform frequent audits, or monitor changes to operations over time.

Extend Your Operational Analytics Beyond IT and Improve Your Business Outcomes

Operational analytics is of vital importance to IT organizations today. With complex hybrid infrastructures and dynamic workloads commonplace in many businesses, the ability to monitor important metrics like application performance requires a level of automation and analysis that can quickly turn data into useful information for your IT team.

Importance of Monitoring IT Infra for Banking and Financial Institutions

Anis Choudhury, Regional Manager, Motadata shares his thoughts on the importance of effectively monitoring bank's & financial services' IT infrastructure at Elets #BFSI Gamechanger Summit. He highlighted how Motadata's unified product suite enables organizations to monitor all the components with real-time data for IT security, increased operational efficiency and improved key decision making through #logmanagement & #networkmonitoring.

How to Monitor Apache Web Server

In order to effectively manage and monitor your infrastructure, a web admin needs clear and transparent information about the types of activity going on within their servers. Server logs provide a documented footprint of all traffic and errors that occur within an environment. Apache has two main log files, Error Logs, and Access Logs.

Apache Error Log & Apache Access Log: Complete Guide to Analyzing and Troubleshooting Apache

+ Bonus: 20 Apache errors – a free checklist Apache error logs and Apache access logs contain valuable data. In this article, we explain how the log files generated by the Apache web server are an important factor in keeping your web sites and apps running 24/7. We show you how to effectively use Apache logs to monitor and troubleshoot Apache log files, to protect and fix your web server. Want to get Apache/Tomcat/Log4J insights right away?

Historical data analytics with Logz.io

Have you ever found yourself trying to reconstruct an event from the past only to come up blank because you cannot go so far back in time? If only you could bring back that missing piece of the puzzle! In the world of IT, logs are the way machines and software record events. They help us understand when an event happened, where they happened and most importantly, why they happened.

Monitoring GitHub Activity with LogDNA

Source code management (SCM) is a core component of DevOps. In addition to storing and sharing source code, SCM tools maintain an ongoing history of changes. Reviewing this history provides numerous insights into your development process, including: How often code changes are submitted, The impact of changes on application performance, Which changes result in errors, bugs, or broken builds.

Where to Find IIS Log Files

Microsoft Windows Internet Information Services (IIS) log files provide valuable information about the use and state of applications running on the web. However, it’s not always easy to find where those files are to determine important aspects of app usage like when requests for servers were made, by whom, and other user traffic concerns.

Software visibility is the key to innovation

Software is eating the world. How we spend time, what we eat, who we meet, how we communicate, where we travel... is defined by the code. Increasingly, software is calling the shots and telling humans what to do. With deep learning, this trend is just going to accelerate. The most powerful companies that used to rule the world with professional, skilled executives are becoming incumbents getting disrupted.

Embrace Data Chaos

The data explosion is here and the complexity can be overwhelming. But there’s opportunity in the chaos and we can help you make the most of it. With Splunk, you can start finding actionable insights in your raw data right away, without cleansing or structuring—even if that data is in motion. Instead of struggling with or trying to fight the chaos, embrace the chaos and put your data to work, with Splunk.

Introduction to Apache Web Server

Apache HTTP Server is a free and open-source web server that delivers web content through the internet. It is commonly referred to as Apache and after development, it quickly became the most popular HTTP client on the web. It’s widely thought that Apache gets its name from its development history and process of improvement through applied patches and modules but that was corrected back in 2000.

Logz.io and Microsoft Azure: A Proud Partnership in Open Source

Today, I’m excited to announce a partnership between Logz.io and Microsoft Azure. With this partnership, Logz.io is now offering Azure customers a fully managed, scalable machine data analytics platform built on ELK and Grafana. What does that mean? Azure customers can now easily deploy, run, and scale ELK without the hassle and pain of maintaining and managing the stack themselves.

The Why Behind Modern Architectures

These days we spend a lot of time talking about modernizing our stack, modernizing our architectures, using new application components, modern application life cycles, etc. So, what is this all about and why do we spend so much time talking about it? First, there is a lot of self-serving vendor speak involved…starting with cloud providers and closely followed by open source commercialization shops and commercial ISVs (ourselves included) who have to spin the world in their own image.

How Loki Correlates Metrics and Logs -- And Saves You Money

The situation is all too familiar: You get an alert. You look at your metrics and your dashboards to try and find out what the cause might be and when the incident actually started (instead of when the alert happened). Then you have to go somewhere else to look at logs because eventually you need more data.

How Big Data and Log management work hand in hand

As Stephen Marsland once said, “if data had mass, the earth would be a black hole.” A vast part of the immense amount of structured and unstructured data that we call “Big Data” is nothing but machine-originated log data. Logs are generated for a lot of different purposes – from security to debugging and troubleshooting. They constitute a gold mine of useful information and actionable insights if properly stored, managed, and analyzed.

GDPR and Data Loss Protection: A Guide to Safeguarding Your Data

The European Union’s General Data Protection Regulation (GDPR) came into effect on May 25, 2018. Hailed as the most significant change in data privacy regulations in two decades, GDPR was the result of years of intense activity and discussions among legislators, consumer groups, the legal community, and data privacy specialists.

What's New in Splunk Enterprise 7.3?

Learn how Splunk Enterprise 7.3 can help you turn all of your data — including unknown and untapped dark data — into actionable insights. Technical Marketing Manager, Giovanni Mola, explains the newest features including additional data source support for AWS and Kinesis Firehose, mobile access, instant metric data visualization without SPL, and more.

Connected Experiences from Splunk

Welcome to Connected Experiences from Splunk, a suite of apps that lets you bring more data insights to more people in more places. With Splunk TV, Splunk AR and Splunk Mobile, we’re making it easier than ever for people on the move and even people who don’t know SPL to get closer to their data. Get connected with Connected Experiences from Splunk today.

Cloud Foundry Summit, Google Cloud Next, Container World, DockerCon and more

April was one of our busiest and exciting month of events so far. Here’s a recap of where we were, what we saw and where you can catch us next. While writing this, we are on the road at both DockerCon and Open Infrastructure Summit so if you are there, don’t hesitate to find our pink shirts to meet us and get a demo!