Operations | Monitoring | ITSM | DevOps | Cloud

The latest News and Information on Log Management, Log Analytics and related technologies.

Monitor Amazon EKS Distro (EKS-D) with Splunk Infrastructure Monitoring

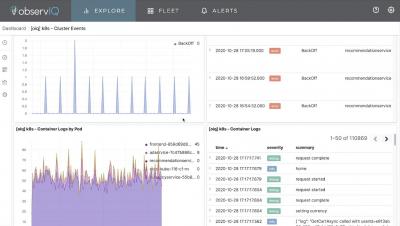
We are excited to partner with AWS in launching Amazon EKS Distro (EKS-D), the official Amazon Kubernetes distribution, which includes the same secure, validated, and tested components that power Amazon EKS. Splunk Infrastructure Monitoring provides a turn-key, enterprise-grade Kubernetes monitoring solution for Amazon EKS. Additionally, Splunk Infrastructure Monitoring provides out-of-the-box monitoring of Kubernetes Control Plane.

5 Essential MySQL Database Logs To Keep an Eye on

MySQL is the de facto choice for open-source relational databases, and you should learn how to use MySQL database logs to improve efficiency and security. As an open-source product, it is free to use and has a large and active developer community. It is crucial to understand how to diagnose and monitor the performance of a MySQL instance in the long run. Logs to the rescue!

How to Maximize Logging Performance with Kafka

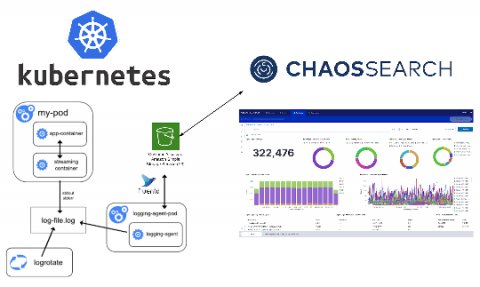
As software is evolving away from monoliths and towards service-based architectures, it is becoming more apparent than ever that logging performance needs to be a first-class consideration of our architectural designs. This article will explore how to build and maintain a logging solution for a microservice-oriented containerized application, how to address some common difficulties which come with running such a solution, plus some tips for debugging and eliminating bottlenecks.

What You Need to Know About IoT Logging

The Internet of Things (or, IoT) is an umbrella term for multiple connected devices sharing real-time data, and IoT logging is an important part of this. Troubleshooting bug fixes, connection problems, and general malfunctions rely heavily on logs, making them an invaluable asset not only in designing systems but also in system maintenance. To maximize system potential, this plethora of generated data needs to be managed efficiently.

Announcing auto-complete with type hints in the Elasticsearch Python client

Python introduced support for type hints in Python 3.5 via PEP 484, allowing tools like Mypy and Pyright to check your Python code for type conflicts before execution. This also helps tools that provide code auto-complete — like IDE, IPython, and Jupyter Notebooks — by providing a complete function signature, even for functions that are generated on import time like the Elasticsearch Python client.

AWS re:Invent 2020: The Sessions and Activities We Can't Wait to See

Needless to say, 2020 has been a year to remember. So it goes without saying that re:Invent 2020 will be unforgettable as well, but this time, in a good way. For starters, instead of hopping on a plane and spending four days in Las Vegas, we get three weeks of it from the comfort of our home offices. As usual, the event will be jam-packed with speakers, presentations, hands-on learning sessions. They’ll be helmed by experts in the cloud computing, DevOps, and the open source community.

IT security under attack blog series: Instant domain persistence by registering a rogue domain controller

In this blog in the IT security under attack series, we will learn about an advanced Active Directory (AD) domain controller (DC) attack to obtain persistence in AD environments. Dubbed DCShadow, this is a late-stage kill chain attack that allows a threat actor with admin (domain or enterprise admin) credentials to leverage the replication mechanism in AD to register a rogue domain controller in order to inject backdoor changes to an AD domain.

Troubleshooting PostgreSQL: How to Use Logs and Metrics to Fix Slow Queries

Imagine some users complaining that querying PostgreSQL is slow (this never happened right?), and we have to troubleshoot this problem. It could be one of two things: I would normally first check on the environment, specifically PostgreSQL metrics over time. Such monitoring shows if the CPU is too high or how many disk reads were buffer reads. PostgreSQL logs also give information about the environment, such as how many statements were run and if any errors occurred.