Operations | Monitoring | ITSM | DevOps | Cloud

Monitoring

The latest News and Information on Monitoring for Websites, Applications, APIs, Infrastructure, and other technologies.

Announcement: New Integration With Panther Labs SIEM

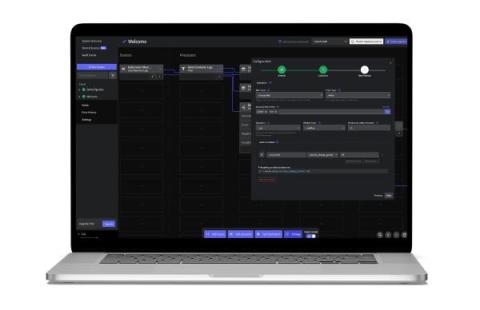
Observo.ai is excited to share that we now integrate with Panther Labs, a modern SIEM built for the cloud. This enables Panther users to leverage Observo.ai’s powerful telemetry data pipeline features. Observo.ai was created to help Security and DevOps teams solve their biggest telemetry problems. Using Artificial Intelligence, Observo.ai optimizes and transforms data from any source and routes it to the destinations where it has the most value.

Kubectl Top Pod/Node | How to get & read resource utilization metrics of K8s?

Kubectl Top command can be used to retrieve snapshots of resource utilization of pods or nodes in your Kubernetes cluster. Resource utilization is an important thing to monitor for Kubernetes cluster owners. In order to monitor resource utilization, you can keep track of things like CPU, memory, and storage. In this article, we will see how to use kubectl Top command to get and read metrics about pods and nodes. We will also breakdown the output to understand what it means.

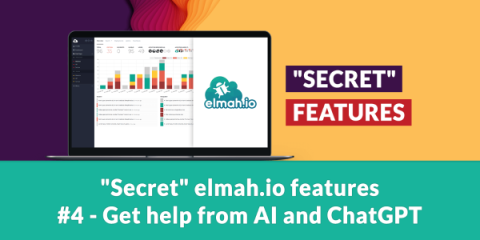
"Secret" elmah.io features #4 - Get help from AI and ChatGPT

In this fourth post in the series of "secret" elmah.io features, I want to introduce you to one of several AI features available on elmah.io. We have had machine learning features like automatic bot detection and spike identification for years. But a recent addition to the portfolio of AI features is the integration with ChatGPT to get help solving issues. In this post, I'll show you how to set it up and how it works.

Does Your Observability Practice Lack Maturity? Here's What to Do.

Observability isn’t new. But organizations are struggling to adopt mature observability practices, and the impact on business is palpable. Organizations are seeing the value of observability for their applications and infrastructure—the results of our 2024 Observability Pulse survey of 500 global IT professionals reflects that across the board.

LAMA Reporting: How can Site24x7 save the day?

When the National Stock Exchange of India (NSE) deliberated on an approach to making cloud computing accessible and compliant to handle brokerage systems, the questions that needed immediate attention were:- How to handle technical glitches during peak trading hours?- What would it take for stock brokers to use cloud computing to navigate the intricate world of trade and investment without revenue loss?

Introducing Elastic's OpenTelemetry Distribution for Node.js

We are delighted to announce the alpha release of the Elastic OpenTelemetry Distribution for Node.js. This distribution is a light wrapper around the OpenTelemetry Node.js SDK that makes it easier to get started using OpenTelemetry to observe your Node.js applications.

What's New With Mezmo: Real-Time Alerting

Here at Mezmo, we see the purpose of a telemetry pipeline is to help ingest, profile, transform, and route data to control costs and drive actionability. There are many ways to do that as we’ve previously discussed in our blogs, but today I’m going to talk about real-time alerting on data in motion, yes - on streaming data, before it reaches its destination.

Latest Top 11 Observability Tools in Spotlight - 2024's Guide

In microservices architecture, observability tools enable you to create central dashboards to gauge the health of your distributed systems. New age observability tools have shifted to providing quick workflows to debug application issues. In this post we will explore top 11 observability tools that you can consider to use for your software systems. In today's digital economy, distributed architectures have become the norm.