Operations | Monitoring | ITSM | DevOps | Cloud

Monitoring

The latest News and Information on Monitoring for Websites, Applications, APIs, Infrastructure, and other technologies.

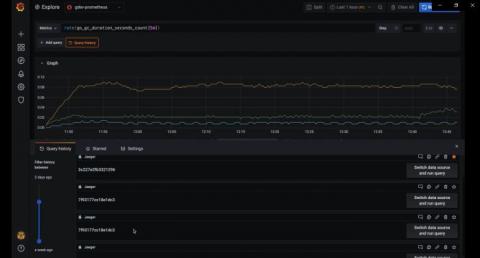
Grafana 7.0 sneak peek: Query history in Explore

Grafana v7.0 is coming next month! Here’s a sneak peek of one of its features: the query history in Explore. Query history lets you view the history of your querying. All queries that have been starred in the Query history tab are displayed in the Starred tab. This allows you to access your favorite queries faster and to reuse these queries without typing them from scratch.

Monitoring AWS Analytics

Amazon Web Services (AWS) products are countless, and at LogicMonitor, we are working tirelessly to bring monitoring support to as many of them as possible. With so many products and tools already on your plate, we want to make sure that monitoring is not a hassle, but rather a trusted companion. Here, we will focus on the analytics section of AWS and provide some tips on how to utilize the data collected from AWS Athena and Glue.

Mastering Azure Monitor, with Richard Benwell

With more and more businesses moving into the cloud, many of us are increasingly faced with the need to monitor our Azure applications in Azure Monitor – but where to start? If you’re feeling lost or overwhelmed by the platform’s sheer range of functionality, you’re not alone, and we’ve got some useful resources for you.

Artificial Intelligence and IT - Keys to a Great AIOps Solution

Artificial Intelligence (AI) – once the basis of Science fiction is now reality. Though it is often accused of being a mere buzzword, it is very difficult to overstate its impact on the human experience, and as AI’s integration becomes more global it is necessary to understand its potential. It is important to zero in on what AI has to offer Information Technology and how integrating an AIOps driven IT department is beneficial to an enterprise.

Announcing the Open Observability Conference

Today, I’m excited to announce the Open Observability Conference – a virtual event on May 27th at 11:00am EDT providing a platform for learning, sharing and discussion of open source observability technologies for DevOps teams around the globe. Register for the Open Observability Conference here.

Page speed check: a comprehensive test of your site

Instant check You can run it any time from HostTracker main page for free - and it really helps to see how your website performs from different countries and find its weak spots, if there are any. Let us check what we see there, if we test google.com: Top line shows us basics about the loaded page: how many http requests have been made to complete it, if all of them were successful, its size and load time.

The SRE Dogfood Series: SignalFx SRE Team

Splunk is a tech company, which regularly gives us exposure to modern development practices, and the ability to implement them with our own technology. We want to share that with you. In this post, as part of a dogfooding series, I sat down with Ram Jothikumar, Head of Cloud Infrastructure & Operations for Observability at Splunk. Ram and I talk about how we support our SignalFx offering at scale, efficiently with resilience and reliability baked in.

NodeJS Instrumentation - Adding Custom Tags to Spans | Datadog Tips & Tricks

In part 1 of this 4 part series, you’ll learn how to use manual instrumentation to add additional detail to traces. We’ll add new tags, or attributes, to the spans generated by our NodeJS application, allowing for more insightful data visualizations in App Analytics.

Integrating eG Enterprise with Microsoft Power BI for Application and Infrastructure Performance Analytics

Microsoft Power BI is a business analytics solution providing interactive visualizations and business intelligence capabilities from data and provides an interface that is simple enough for admins to create their own reports and dashboards. Data inputs to Power BI can come from multiple sources – Excel worksheets, CSV files, database tables, log files, the web, etc. It then employs smart visualizations and built-in AI technologies on that data to turn it into interactive insights.