Operations | Monitoring | ITSM | DevOps | Cloud

The latest News and Information on Log Management, Log Analytics and related technologies.

Exploring the Value of your Google Cloud Logs and Metrics

With our ability to ingest GCP logs and metrics into Splunk and Splunk Infrastructure Monitoring, there’s never been a better time to start driving value out of your GCP data. We’ve already started to explore this with the great blog from Matt here: Getting to Know Google Cloud Audit Logs. Expanding on this, there’s now a pre-built set of dashboards available in a Splunkbase App: GCP Application Template for Splunk!

Analyze JMX to Better Assess The Health Of Your Java Applications

Java Management Extensions, or JMX, was first added to J2EE, and it has been part of J2SE since the 5.0 release. The JMX API aims to provide a standard for monitoring and managing Java-enabled applications and services. In this article, we will explain the JMX architecture and show you how to pull the metrics that it generates into your Sumo Logic account in order to gain unique insights and a more thorough understanding of the health of your application and services.

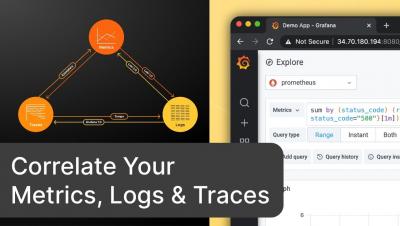
Correlate Your Metrics, Logs & Traces with the curated OSS observability stack from Grafana Labs

Correlation between metrics, logs, and traces should be as effortless as possible. This helps you make better decisions and actions. The Grafana Labs open-source observability stack enables powerful correlations between your metrics, log, and traces. The key here is to have consistent metadata across the three pillars of observability. Let me demo you how this works in this video.

Logging Errors in Web Workers

Release 3.8.0 of the TrackJS browser agent added support for Web Workers, which adds some awesome new observability to the background tasks of your web applications. Many development teams have adopted Web Workers to their web applications to add offline support, caching, or to process heavy tasks. Workers allow web apps to feel faster by removing work from the user interface thread.

12 Best Docker Container Monitoring Tools

Monitoring systems help DevOps teams detect and solve performance issues faster. With Docker and Kubernetes steadily on the rise, it’s important to get container monitoring and log management right from the start. This is no easy feat. Monitoring Docker containers is very complex. Developing a strategy and building an appropriate monitoring system is not simple at all.

Increasing limits for three key Cloud Monitoring features

Cloud Monitoring is one of the easiest ways you can gain visibility into the performance, availability, and health of your applications and infrastructure. Today, we’re excited to announce the lifting of three limits within Cloud Monitoring. First, the maximum number of projects that you can view together is now 375 (up from 100). Customers with 375 or fewer projects can view all their metrics at once, by putting all their projects within a single workspace.

Cloud Data Retention & Analysis: Unlocking the Power of Your Data

Enterprise data growth is accelerating rapidly in 2021, challenging organizations to adopt cloud data retention strategies that maximize the value of data and fulfill compliance needs while minimizing costs. To meet this challenge, organizations are adopting or refining their cloud data retention strategies. In this blog post, we’ll take a closer look at the state of data retention and analytics in the cloud.

Why you should use Central Error Logging Services

Logs are vital for every application that runs in a server environment. Logs provide essential information which points to whether the current system is operating properly. Looking through logs, you will gather data on system issues, errors, and trends. However, it is not feasible to manually look up errors on various servers across thousands of log files. The solution? Central errors logging services.