The latest News and Information on Log Management, Log Analytics and related technologies.
Cloud services make the daily tasks of business easier. They enable remote workforce collaboration, streamline administrative tasks, and reduce capital costs. However, these “pros” come with a few “cons.” The IT stack’s increased complexity means staff work across divergent log management tools when something breaks. Centralized log management for the cloud makes root cause analysis easier by aggregating all event log data in a single location.
Any organization with data assets is a possible target for an attacker. Hackers use various forms of advanced cyberattack techniques to obtain valuable company data; in fact, a study by the University of Maryland showed that a cyberattack takes place every 39 seconds, or 2,244 times a day on average. This number has increased exponentially since the COVID-19 pandemic forced most employees to work remotely, and drastically increased the attack surface of organizations around the world.
LogDNA recently celebrated 5 years since our launch in Y Combinator and during this half-a-decade we’ve learned several lessons about balancing cost and scalability. As a founder, here are the top 3 things I wish someone had told me as we were racing towards success. The appeal of building a cloud-native application for a startup is a no brainer—it’s agile, scalable, and can be managed by a distributed team. Not to mention, it’s the cheapest way to get off the ground.
If you’re investigating an incident, every minute means degraded performance or even downtime for customers. The causes of an issue often come from parts of your systems and applications that you would not think to check, and the sooner you can bring these to light, the better.
With our ability to ingest GCP logs and metrics into Splunk and Splunk Infrastructure Monitoring, there’s never been a better time to start driving value out of your GCP data. We’ve already started to explore this with the great blog from Matt here: Getting to Know Google Cloud Audit Logs. Expanding on this, there’s now a pre-built set of dashboards available in a Splunkbase App: GCP Application Template for Splunk!
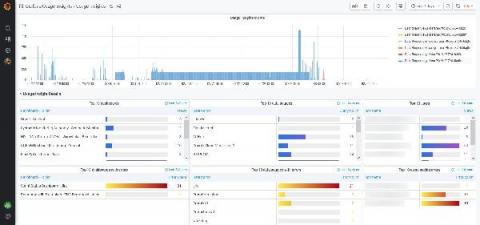
We first released the usage insights Enterprise feature in Grafana 7.0 based on feedback from customers that they would like to better understand how their users are interacting with Grafana, including the dashboards they visit, the information they query, and where they run into issues. What we learned was that dashboard sprawl is a real issue: Administrators estimate that almost 60% of dashboards might not be used at all.