Operations | Monitoring | ITSM | DevOps | Cloud

The latest News and Information on Log Management, Log Analytics and related technologies.

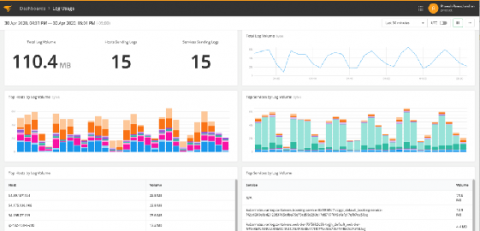
Let's Dive In: JFrog Unified Platform and Splunk - John Peterson, Senior Partner Engineer, JFrog

In our lightning talking will we cover the JFrog Unified Platform integration with Splunk for a wholistic analytics view into the unified platform logs. Combining the two best of breed applications makes tremendous sense for an enterprise without it valuable data insights are lost as well as any action the business might have taken. We will cover how to setup this integration, valuable data insights that can be gained, and how you can extend this integration to discover all new data insights you will wished you always had.

Stretch Your Reach with Unified JFrog Data and Elastic

DevOps teams rely on Artifactory as the bread and butter tool of universal binary repo managers, but observing its operations can be challenging. With multiple high availability nodes and unification with Xray as the JFrog DevOps Platform, that operations data is spread out across logs for each service in the JFrog Platform deployment. Operations teams need a view into valuable data insights that can only be gained through real time data mining and observation of the platform.

Improving Application Quality through Log Analysis

Throughout the history of software development, one statement has remained true: no application is perfect. Due to that fact, development organizations must work with all resources at their disposal to limit the impact that application problems have on the end-user. Server log files represent an important resource that should be referred to during the process for troubleshooting any application issue.

Importance of System Resource Monitoring on Graylog, Elasticsearch, and MongoDB Servers

The first thing we tell Graylog users is, “Monitor your disk space.” The core set of metrics discussed below should always be in acceptable parameters and never grow over extended periods without going back to normal levels. This is why it is critical to monitor metrics that come directly from the hosts running your Graylog infrastructure.

Logging Best Practices Part 1 - Priority Number 1

Isn’t all logging pretty much the same? Logs appear by default, like magic, without any further intervention by teams other than simply starting a system… right? While logging may seem like simple magic, there’s a lot to consider. Logs don’t just automatically appear for all levels of your architecture, and any logs that do automatically appear probably don’t have all of the details that you need to successfully understand what a system is doing.

The Splunk App for Infrastructure: Getting Started with Metrics & Logs Together for Easy Infrastructure Monitoring

If I asked you to describe Splunk, you’d likely reply with something about it being really good (the best!) at gathering and searching logs. You’re right! But while that’s true, you may not know Splunk is also tops at gathering and analyzing metrics. Putting the two together is very powerful; logs (events, more generically) and metrics go together like cookies and milk!