Improving security: Aiven and GitHub's secret scanning partnership
Announcing Aiven’s partnership with GitHub's secret scanning program to protect your cloud data infrastructure.


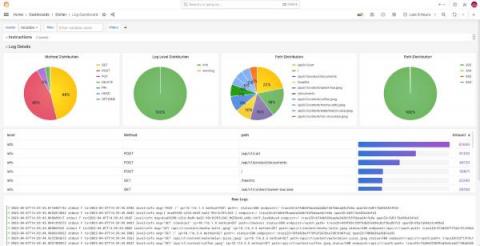
Because of where you’re reading this post, I’m going to assume you already know that Grafana is a great tool for visualizing and presenting metrics, and persisting them on dashboards. Ever since the Grafana Loki query builder for LogQL was introduced in 2022, it’s been easy to display and visualize logs, too.
Tune into any sports game and you’ll likely see an iGaming ad at some point. Sports betting or online slots have become so ubiquitous in the modern age that the United Kingdom now has one of the largest online gambling markets in the world. Due to their high-thrills gaming and transactional nature, gambling websites face more performance issues than most. This is why it’s so important to monitor website performance, looking at conversion rate optimisation and security.
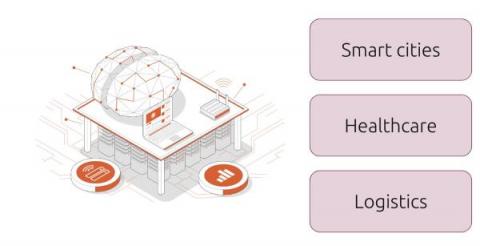
The public sector is investing heavily on artificial intelligence and machine learning initiatives. Deloitte AI Institute reported that 60% of government AI and data analytics investments aim to directly impact real-time operational decisions and outcomes by 2024. From automating redundant tasks to increasing the quality of services offered to citizens, public sector institutions have a wide range of applications where they could implement AI.
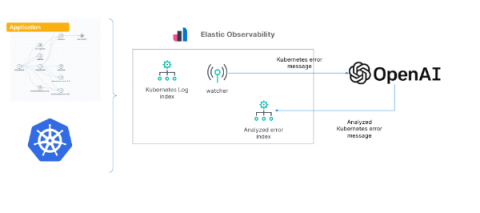
As we’ve shown in previous blogs, Elastic® provides a way to ingest and manage telemetry from the Kubernetes cluster and the application running on it. Elastic provides out-of-the-box dashboards to help with tracking metrics, log management and analytics, APM functionality (which also supports native OpenTelemetry), and the ability to analyze everything with AIOps features and machine learning (ML).
More than 26,000 software vulnerabilities were discovered in 2022 – a new record – and critical vulnerabilities were up 59% over 2021, the previous record-high year. In other words, despite years of DevSecOps, software doesn’t seem to be getting more secure. Release management can help. A crucial goal of release management is vulnerability-free software.
ServiceNow’s first single, global, in-person user conference since 2019, Knowledge 2023, drew more than 15,000 people. The enthusiasm among attendees was contagious. The opening keynote of this year’s conference in Las Vegas was standing room only.
AppSignal Logging gives you 360-degree insights into your application's performance. To help give you those insights, we wanted to ensure our logging solution allowed you to send AppSignal your logs your way. You can now use Winston transport to send your Node.js application's logs directly to AppSignal and take advantage of having access to all of your application's performance logs and metrics in one place.
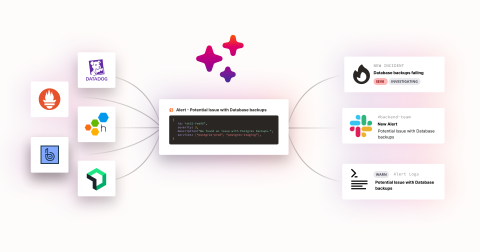
Here’s a crazy question: why do we still require a human to manually declare an incident for the things that we know are incidents? If we have enough confidence to build SLOs and high-severity alert routes for these specific scenarios, why are we still asking a human to confirm it’s an incident and get the assembly process in motion? Isn’t that just another button to push when we could be problem solving instead?
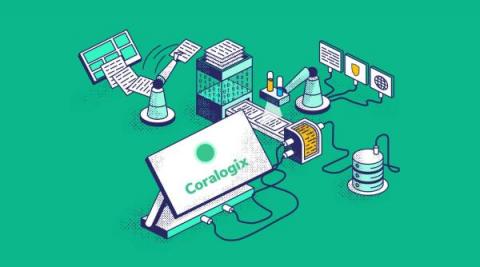
Coralogix is a full-stack observability platform that effortlessly processes logs, metrics, traces, and security data. More specifically, logs in Coralogix are processed in larger volumes than almost any other observability provider out there, making a log’s life cycle unique. This article will examine the different stages of logs and help you better understand one of the most sophisticated telemetry processing architecture on the market.