The latest News and Information on Monitoring for Websites, Applications, APIs, Infrastructure, and other technologies.
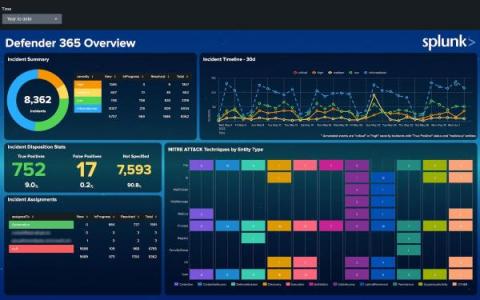
Dashboards are a powerful tool for communicating a lot of information at once. Many Splunk apps are packaged with dashboards to help you make the most of your data. For example, the Microsoft 365 App for Splunk comes with a number of dashboards to provide insights around usage, incidents, and more.
Note 8.3.0 has an issue that could cause creating and accessing snapshots against Azure snapshot repositories to fail authenticating when using SAS tokens. This impacts self-managed customers who have deployed 8.3.0. Elastic Cloud Azure deployments are not currently being upgraded to 8.3.0 and are not impacted as a result. Visibility is crucial for ensuring application performance but it can be difficult to efficiently scale monitoring across all your critical infrastructures, platforms, and services.
Frontend monitoring is a process of tracking and maintaining the health of an application’s client-side. It involves monitoring the availability, functionality, and performance of the client-side of an application. We can segment a web application into two parts. I.e., client-side and server-side.