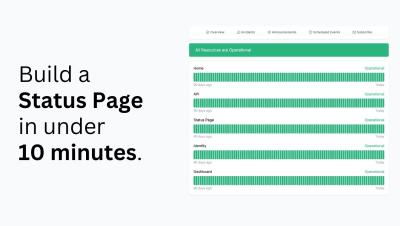
Squadcast Unveils Enhanced Status Pages
Big News! Squadcast's Enhanced Status Page(s) are LIVE!


The latest News and Information on Incident Management, On-Call, Incident Response and related technologies.
Dear Current and Future Moogsoft Customers, I am happy to announce that Dell Technologies has acquired Moogsoft on September 17, 2023. This is good news for existing and future Moogsoft and Dell customers. Earlier this year Moogsoft embarked upon raising capital to accelerate growth.
Data is both a challenge and an asset for IT professionals, who rely on IT Operations Analytics (ITOA) to guide them towards operational excellence, system reliability, and swift incident resolution. So whether you’re seeking clarity on understanding what ITOA is and its connection to related technologies, are contemplating how to use it within your organization, or are curious about its enhanced efficiency and cost savings benefits, we’ve got you covered.
The incidents page, the most visited page on Zenduty, has an all-new look and feel! It's been completely redesigned from the ground up to be faster, easier to use, and more visually appealing. The Incidents list now dedicates more space for important information, such as the title, date, priority, and more. The UI is also more polished, shaving off whitespace where unnecessary. The avatars have been redesigned with more pastel shades, resulting in an overall design far more soothing to the eye.