The latest News and Information on Log Management, Log Analytics and related technologies.
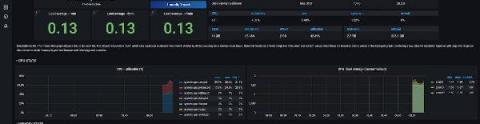
We are pleased to announce the beta launch of hosted Grafana in addition to our existing ELK as a Service & hosted Open Distro services. As organisations around the world are constantly looking for ways that they can ensure compliance is being upheld, speeding up Mean Time To Repair (MTTR) and reducing the risk of DDoS attacks, managed Grafana forms a vital role in improving metrics observability across the entirety of your infrastructure.
Enterprises often have several servers, firewalls, databases, mobile devices, API endpoints, and other infrastructure that powers their IT. Because of this, organizations must provide resources to manage logged events across the environment. Logging is a factor in detecting and blocking cyber-attacks, and organizations use log data for auditing during an investigation after an incident. Brokers, such as Apache Kafka, will ingest logging data in real-time, process, store, and route data.
Today we’re excited to announce the latest development in our ongoing partnership with Google Cloud. Now developers, site reliability engineers (SREs), and security analysts can ingest data from Google Pub/Sub to the Elastic Stack with just a few clicks in the Google Cloud Console. By leveraging Google Dataflow templates, Elastic makes it easy to stream events and logs from Google Cloud services like Google Cloud Audit, VPC Flow, or firewall into the Elastic Stack.