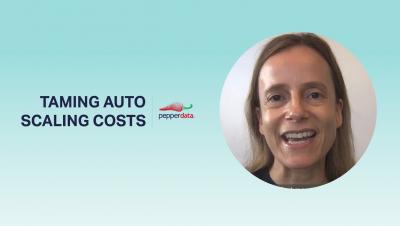
How To Significantly Tame The Cost of Autoscaling Your Cloud Clusters
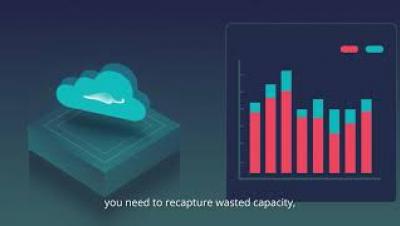
Hi everyone. My name is Heidi Carson and I’m a product manager here at Pepperdata. Today, I’m going to share a bit about how you can tame the cost of autoscaling your cloud clusters. As you may well be aware, the incredible flexibility and scalability of the public cloud make it an appealing environment for modern software development. But, that same flexibility and scalability can lead to runaway costs when the cloud doesn't scale the way you might expect.