Operations | Monitoring | ITSM | DevOps | Cloud

September 2020

The Ultimate, Free Incident Retrospective Template

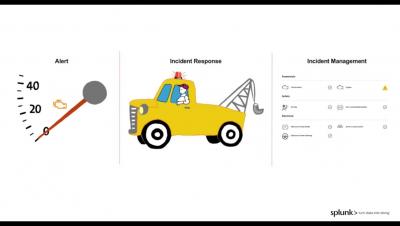
Incident retrospectives (or postmortems, post-incident reports, RCAs, etc.) are the most important part of an incident. This is where you take the gift of that experience and turn it into knowledge. This knowledge then feeds back into the product, improving reliability and ensuring that no incident is a wasted learning opportunity. Every incident is an unplanned investment and teams should strive to make the most of it.

Best Practices: Onboarding Jfrog Xray

JFrog Xray is a Software Composition Analysis tool (SCA) which is tightly integrated with JFrog Artifactory to ensure security and compliance governance for the organization binaries throughout the SDLC. This video provides best practices learned from customers for successfully deploying JFrog Xray into your organization and performing a real Shift-Left. It will focus on two keys to success, 1. involving R&D and 2. starting small and working in cycles.

Gain Better Visibility into Kubernetes Cost Allocation

Adopting Kubernetes and service-based architecture can bring many benefits to organizations – teams move faster and applications scale more easily. However, visibility into cloud costs is made more complicated with this transition. This is because applications and their resource needs are often dynamic, and teams share core resources without transparent prices attached to workloads.

Introducing Puppet Enterprise tasks and workflows in Puppet Remediate

Today we are pleased to announce the release of Puppet Remediate 1.4. This release brings together the dynamic vulnerability data and prioritization capabilities in Puppet Remediate with Puppet Enterprise’s industry-leading automation to help organizations improve their security posture and reduce the risk of security incidents.

Speed Up Your Maven Builds With Jfrog Artifactory

The code we develop ends up being packaged into artifacts that are consumed as dependencies during the development of other software components. JFrog offers an end-to-end Maven repository solution to resolve complex challenges that come with consuming and developing all these artifacts. There are many reasons why you may want to use JFrog Artifactory as your Maven repository. As a Maven repo, Artifactory is both a source for artifacts needed for Maven builds and a target to deploy artifacts generated in the build process.

Is your microservice a distributed monolith?

Your team has decided to migrate your monolithic application to a microservices architecture. You’ve modularized your business logic, containerized your codebase, allowed your developers to do polyglot programming, replaced function calls with API calls, built a Kubernetes environment, and fine-tuned your deployment strategy. But soon after hitting deploy, you start noticing problems.

The Catchpoint Open Source Software (OSS) Program

Catchpoint has always embraced new technologies and ideas. We offer a powerful monitoring platform with advanced features such as tracking digital performance from across the globe, capturing analytical data and the ability to get notified across various channels. With all these inbuilt features in hand, Catchpoint encourages its customers to build new monitors and integration that consumes monitoring data that are tailored to specific use cases.

Restore authority with Token Bandwidth Controls!

Now you can go beyond measuring your bandwidth usage and regain control via Cloudsmith's new bandwidth controls for Entitlement tokens. You can craft tokens with individual usage limits using the UI, API, and CLI, allowing you to decide the exact level of usage for each token. Combining the new and existing limits for entitlement tokens, allowances are configurable to provide fine-grained control for any combination of properties.

How to monitor istiod

Istio is a service mesh that enables teams to manage traffic in distributed workloads without modifying the workloads themselves, making it easier to implement load balancing, canarying, circuit breakers, and other design choices. Versions of Istio prior to 1.5 adopted a microservices architecture and deployed each Istio component as an independently scalable Kubernetes pod. Version 1.5 signalled a change in course, moving all of its components into a single binary, istiod.

New Microsoft partnership embeds Datadog natively in the Azure portal

We are excited to announce a new partnership with Microsoft Azure, which has enabled us to build streamlined experiences for purchasing, configuring, and managing Datadog directly inside the Azure portal. This first-of-its-kind integration of a third-party service into a public cloud provider reduces the learning curve for using Datadog to monitor the health and performance of your applications in Azure—and sets you up for a successful cloud migration or modernization.

Set up Let's Encrypt TLS Encryption using the HAProxy Kubernetes Ingress Controller

When it comes to TLS in Kubernetes, the first thing to appreciate when you use the HAProxy Ingress Controller is that all traffic for all services traveling to your Kubernetes cluster passes through HAProxy. Requests are then routed towards the appropriate backend services depending on metadata in the request, such as the Host header. So, by enabling TLS in your ingress controller, you’re adding secure communication to all of your services at once. HAProxy is known for its advanced support of the important performance-oriented features available in TLS.

What is an inode and what are they used for?

Inodes, speculated to be short for “index nodes,” have been around since the introduction of the first UNIX file system around the late 1970s. They were adopted into Linux in the 90s—and for good reason. They’re an excellent way to keep track of how your files are stored, and the method many systems are still based on today.

Why Network Slicing is the Holy Grail for Telco's in the 5G Era

Legacy generations of networks have predominately provided services with best-effort delivery. While this has worked for voice, text and best- effort broadband services, end users are hampered with buffering, delays, and drops as the demand for feature-rich services continues to grow.

Introducing Cycle.io

Built for businesses of all sizes, the Cycle Platform becomes the bridge between your infrastructure and your software. With its software as a service (SaaS) approach to infrastructure management, any servers deployed via Cycle will automatically receive all platform updates. Empower your developers to do what they do best, and leaving the rest to Cycle. Connect with us: Website: cycle.io Slack: cycle.slack.io Linkedin: linkedin.com/company/cycle-platform/ Twitter: twitter.com/cycleplatform Facebook: facebook.com/CyclePlatform

Answering the 5 Whys During Root Cause Analysis

In today’s IT’s landscape, a variety of tools are available to us to help with root cause analysis process. Leveraging your tools and using them optimally is necessary to any system but it’s important to remember that tools do not have access to all the information available for them to be able to truly solve every problem So to truly get to the true root cause, you need a process that will take us beyond the scope of tools.

Managing Sensu Go 6 using Ansible

Earlier this year, we shared the certified Ansible Collection for Sensu Go, which makes it easy to automate your monitoring and achieve real-time visibility into auto-scaling infrastructure. Now that Sensu Go 6 has been released, we’ll share the latest updates on the Collection, including the management aspects of Sensu Go 6, with a focus on the structure of Ansible playbooks in the Sensu Go 6 world.

Streamline Open-Source Security Compliance on Kubernetes with Tanzu Application Catalog

The free availability of hundreds of thousands of open-source applications and components available as containers in public registries like Docker Hub presents both opportunities and challenges for enterprises looking to make the most of their shiny new Kubernetes clusters. Open-source software achieves a wide variety of functionality within modern applications, removing the need for developers to create their own services, such as logging and monitoring, caching, databases, message queues, etc.

Tanzu Observability by Wavefront Delivers Unified Enterprise Observability for DevOps Teams

In conjunction with VMworld 2020, we are announcing new functionalities of Tanzu Observability by Wavefront that accelerate analytics-driven insights and data onboarding for DevOps teams, including developers, Kubernetes operators, and wider operations teams. We have added support for PromQL, expanded packaged application insights, and grown the Tanzu Observability ecosystem—both within the Tanzu portfolio and outside of it—by adding support for popular DevOps and developer tools.

Serve Dynamic Custom Error Pages with HAProxy

Set up custom error pages in HAProxy to ensure consistent, branded messaging that supports any backend web stack. The memory is probably still fresh: You’re shopping online at your favorite website, looking for something specific, you’ve got it narrowed down to two or maybe three products, you make the final decision, click to checkout and then— Internal Server Error. A cryptic error has replaced the page you were expecting. More than surprised, you feel knocked off balance.

Amazon S3 Folders Demystified

Amazon S3 is a highly-scalable object storage system. Amazon S3 can contain any number of objects (files), and those objects can be organized into “folders”. However, to S3, folders don’t really exist. huh? That’s right. “Folders” are a human concept, applied to S3 keys for organizational purposes. But they’re nothing special to S3 itself. Before we begin, forget everything you know about the S3 Management Console.

Reduce Security Cost by Shifting Left

With the emergence of “Shift Left” as common practice for development, we’re seeing many opportunities to reduce costs around our development practices, but what about security? Prisma Cloud is supporting “Shift Left” by making their scanning capabilities available to Developers and CI Tooling to run scans against microservice projects. As a bonus, the Prisma Cloud product suite scanning capabilities fit perfectly within Codefresh.

Securing Financial Transactions with Rancher

“With Rancher and Kubernetes, we’ve started moving to a microservices architecture. What this means is our teams don’t have to know Kubernetes inside out, just the projects they’re working on. Rancher simplifies Kubernetes for technicians, which results in greater agility and innovation.” Tertius Wessels, Senior Vice President of Engineering, Entersekt We’ve all heard about high-profile security hacks and have no doubt been the recipient of phishing emails.

Console Connect IoT connectivity service

PCCW Global Console Connect IoT service is to address challenges in deploying IoT connectivity by offering unified integration through our software defined network, which supports digital transformation and development of new business models and offerings. Billions of IoT devices can be connected, helping you stay relevant to your customers and grow new revenues while helping your customers gain a competitive advantage.

Top Go Modules: Writing Unit Tests with Testify

All developers have seen them, even in well-structured Golang programs: comments suggesting you keep away from lines of code since they seem to be working in a magic way. These warnings make us timid, fearing we might break something. But applications need to change, to improve and innovate. That’s why unit tests are a vital part of software development. They help developers know whether the small parts of their software perform their intended function correctly.

Best Practices for Kubernetes Cost Optimization

If cost optimization is your only reason for adopting Kubernetes and containers, you might be in for a rude surprise — many companies find that costs increase after moving to Kubernetes. Even companies who adopt Kubernetes for other reasons, like time-to-market advantages, should follow basic cost control best practices to stay within the budget.

Why do Kubernetes pods stay in pending state?

Kubernetes refers to an open-source platform managing containerized service. This portable system simplifies automation and configuration. You can link an app in a Kubernetes cluster and connect it to IBM Cloud Kubernetes service through the VPN. In this article, we will focus on why your kubernetes pod stays in pending state.

Interlink Software's Hybrid IT Infrastructure Monitoring solution on Gartner Peer Insights

Interlink is delighted to announce that it has arrived on the Gartner Peer Insights platform. Interlink’s customers can now leave honest reviews of their experiences of how our Hybrid IT Infrastructure Monitoring solution is meeting the challenges of managing service availability in their enterprises.

Flexible control over instance storage

Ocean by Spot provides continuous optimization for the underlying infrastructure of containerized workloads. Launch specifications is a key feature that enables users to manage different types of workloads on the same Ocean cluster. With launch specs, cluster administrators can granularly set specific configurations per application, as needed.

Startup: get the Heroku experience on your AWS account

Heroku meets the needs of individual developers who want to deploy their applications seamlessly. The only requirement is to use a git repository and link your git repository to your Heroku account. However, for startups, Heroku has limitations. Those arguments make most of the startups moving away from Heroku to a more flexible place like AWS - which has 31% market share in Q2 2020.

Best practices for monitoring AWS CloudTrail logs

Engineering teams that build, scale, and manage cloud-based applications on AWS know that at some point in time, their applications and infrastructure will be under attack. But as applications expand and new features are added, securing the full scope of an AWS environment becomes an increasingly complex task. To add visibility and auditability, AWS CloudTrail tracks the who, what, where, and when of activity that occurs in your AWS environment and records this activity in the form of audit logs.

How we went from kops to EKS in production

Amazon’s EKS service (Elastic Container Service for Kubernetes) allows you to create a Kubernetes control plane in your AWS account without having to configure Kubernetes master nodes, etcd, or the api servers. In this blog post we will cover the motivation for using EKS, the preparation required to create an EKS cluster, how to configure EKS in Terraform, and how to set up kube2iam with EKS.

How (Not) to Develop a Modern Product Management Practice at Speed

Tesco Bank has embarked on a digital transformation journey, and at the heart of it lies a shift of culture and the adoption of modern product development practices. What could go wrong? Everything! Culture, leadership, bureaucracy, route to production, you name it. Yet, with the help of VMware Pivotal Labs, we delivered an amazing product during a time of great need for our customers.

DevOps KPIs as a Service: Daimler's Solution

Daimler supports its developers with a centrally curated DevOps toolchain, including a cloud native platform based on Cloud Foundry. The idea is to free hundreds of dev teams from operations scaffolding and allow them to instead focus on delivering their products. “Platform-as-a-product” is the strategy to keep up with the demand and the continuous feature evolution. KPIs are part of the platform. Some are consumed by the platform team to measure the success of the platform itself. Others are provided as “KPIs-as-a-service” to the platform customers.

Microsoft Azure & JFrog: Accelerating Deployment With Virtual Kubelet And Artifactory

Virtual Kubelet simplifies the management of your Kubernetes cluster by rapidly spinning up pods behind an abstraction that takes care of scaling up and down your cluster. JFrog Artifactory is a universal binary repository that serves as a highly scalable container registry with advanced security scanning of container images. By combining Virtual Kubelet on Azure Container Instances (ACI) for fast orchestration and Artifactory to reliably serve container images, you get a highly scalable and secure platform for application deployment.

Cloud Native, You Keep Using Those Words

Ask a hundred IT pros and their managers what “cloud native” is, and you’ll get as many different definitions. In part it’s because public cloud providers (PCPs) seek to provide all things to all IT teams, but it’s also because each organization has different goals for cloud. If I could get away with it, I’d enclose cloud native in quotes whenever it’s unclear what business expectations are for PCPs.

Here's your Complete Definition of Software Reliability

We live in the era of software convenience, where we take for granted that hundreds of services are always at our fingertips. These applications become part of our daily routines because they are so reliable. However, this consistency makes reliability work invisible to the end user. It can be difficult to appreciate the effort behind maintaining a high availability service. Because of that, people may misunderstand exactly what makes a service reliable.

Creating Azure VM images with Packer and Puppet Bolt

HashiCorp Packer is a free and open source tool for creating golden images for multiple platforms from a single source configuration. Packer makes it easy to codify VM images for Microsoft Azure. In this blog post we’ll look at how to use HashiCorp Packer and Puppet Bolt to define our VM templates in code.

Add file attachments to pull requests in Bitbucket Cloud

During code review, static image files might not be adequate when a developer wants to demo their changes. Starting now, teams can attach any type of file to a pull request. No need to worry about the file size either. For example, “before and after” screen recordings can be uploaded and viewed directly in a pull request. With this change, Bitbucket Cloud has become more integrated with the Atlassian ecosystem. Does your team also collaborate on Jira or Confluence?

Monitor your Package Activity and Save on Storage!

With the introduction of the Package Activity API and accompanying CLI command, you can now quickly and easily check your entire repository for packages' activity status or even take a detailed approach and view packages individually (per day/per package). You can save on your storage costs by eliminating inactive packages and retaining only the packages you or your users derive value from storing and distributing via Cloudsmith.

Managing your Log Volume across Multiple Accounts Just Got Easier

Many organizations are adopting centralized logging tools so that they have one place for all of their data. This is generally easier than having separate tools across teams for log storage and analysis. But centralized logging introduces new challenges, like how to segment those logs according to the teams or developers where they are the most relevant. And, how to manage log volume.

Azure Spot VMs - How to enjoy their massive cost savings without suffering any interruptions

If you are running compute workloads in Azure and wondering how you can dramatically reduce costs and minimize infrastructure management all without affecting availability and performance, keep on reading. Back in May Azure introduced a new pricing model, called Azure Spot VMs, providing up to 90% cost savings in comparison to the pay-as-you-go pricing.

Faster Kubernetes Development with Rancher, DevSpace and Loft

Today, Kubernetes is getting more and more important, not only in the world of operations but also in the world of development. Knowledge in Kubernetes is a highly sought after skill. Yet the question remains whether developers should get access to Kubernetes and if they even need to know about Kubernetes at all.

What is Azure Blob Storage?

If you have ever had the need to store large amounts of files and data, then Azure’s Blob Storage is made for you. Microsoft’s Azure Cloud provides huge benefits with not only their fantastic services, locations, availability and support, but also in their almost seemingly infinite capacity. Azure Blob Storage is not only scalable, durable and almost always available it also provides flexibility to scale as your business requirements need.

Event in Review: Splunk's DevOps & Observability Best Practices Event

Last week, Catchpoint was one of the sponsors of Splunk’s half-day DevOps & Observability Best Practices event. It was a jampacked conference that examined what observability is, its key drivers, and how observability and monitoring exist “like two peas in a pod”, perfect compliments to one another in enabling enterprise to better understand overall systems behavior and health.

What are the relevant Integration Tools to Boost Salesforce and SF DevOps Efficiency?

Salesforce is no one of the top-line Customer Relationship Management tools that you can implement to support your business in sales, marketing, lead management, and customer support. However, not just limited to these, but Salesforce had grown a lot over the last decade now to be complete business management and DevOps tool to handle end-to-end enterprise operations. Salesforce now plays a crucial role in increasing productivity and optimizing ROI.

Tags: set once, access everywhere

Tags are essential for aggregating and contextualizing monitoring data across your infrastructure; they enable you to monitor your entire system at a high level, drill down to individual services for more comprehensive analysis, and easily correlate data from every application component. Implementing a consistent and effective tag schema for your applications can be challenging, especially as they grow in complexity.

Progressive Delivery- Using feature flags & observability to ship confidently

Level up your deployments for better resiliency and reliability. After 15 years, the basic revelations of the CI/CD revolution are no longer news—small-batch changes with more frequent releases tend to be more stable and recover faster than lengthy big-bang release cycles. Automated is better than manual, instrumentation is key, and speed is critical. But the promise doesn't stop there.

Investing in Netdata: a growth story

I’m excited to announce an extension to Netdata’s series A funding in the amount of $14.2M, bringing the total amount of funding to $31M. We’re thrilled to share the news; the additional funding will help us continue building the future of health monitoring and performance troubleshooting. In case you missed it, our mission is to redefine infrastructure monitoring. Our unique approach to building the right solution with and for the community is no easy task.

Introduction to Tanzu Build Service 1.0

Manually creating and managing a handful of containers in a production environment is one thing. But at some point, organizations and teams cross a threshold. That specific point will differ by organization, but after this point, the idea of manually patching, testing, and deploying a fleet of containers will become too much.

Get Started with Kubernetes

Brief introduction to understanding Kubernetes basics Kubernetes is a broad platform that consists of more than a dozen different tools and components. Among the most important are: If you use Kubernetes to manage containers, this will require a container runtime, which is the software that runs individual containers. Kubernetes supports a number of container runtimes; the most popular are Docker, containerd, and cri-o.

NoSQL databases: what is MongoDB and its use cases?

Databases like MongoDB, a NoSQL document database, are commonly used in environments where flexibility is required with big, unstructured data with ever-changing schemas. This post explains what a NoSQL database is, and provides an overview of MongoDB, its use cases and a solution for running an open source MongoDB database at scale.

Containerizing your Apps on Cloud and On-Premise using CloudHedge

We can unequivocally state that the Containerization tide is here to stay. Organizations are evaluating when they must opt for it. Whether they should consider containerization on-prem or on-cloud. The pertinent question that they must ask themselves, though, is how to do it best and stay afloat in an efficient manner in the long run. Post COVID19, the industry is adapting to new changes, and containerization of your legacy apps is one of them.

Run .NET Applications in Azure Spring Cloud Using Steeltoe-Now in Public Preview

Fresh off the exciting announcement of Azure Spring Cloud’s general availability at SpringOne, today we are happy to announce the public preview of Steeltoe .NET support. Azure Spring Cloud is a fully managed service for Spring Boot—and now Steeltoe .NET—apps. As a native Azure service, it is operated by Microsoft. But VMware has partnered closely with Microsoft in the development of the service and fully supports Microsoft in its operation of Azure Spring Cloud.

Kubernetes: When You Need It and How to Scale It

Whether you’re years deep into the Kubernetes experience or just dipping your toes into the water, there’s no such thing as too much perspective. After all, Kubernetes is poised to become a foundational element of enterprise infrastructure, and it’s evolving fast. Mistakes made today could lead to some gnarly fixes down the road.

The best of the PowerShell Gallery, right in your PE Console

PowerShell DSC might be the new kid on the block when it comes to configuration management, but it's certainly not lacking in power. DSC resources offer unprecedented hooks into the Windows operating system and provide straightforward configuration functionality that will make your Unix coworkers green with envy. It's a shame it's not easier to use….

Integrating Ansible and Docker for a CI/CD Pipeline Using Jenkins

In this guide, we will use Ansible as a Deployment tool in a Continuous Integration/Continuous Deployment process using Jenkins Job. In the world of CI/CD process, Jenkins is a popular tool for provisioning development/production environments as well as application deployment through pipeline flow. Still, sometimes, it gets overwhelming to maintain the application's status, and script reusability becomes harder as the project grows.

CVE-2020-15598: HAProxy Enterprise Unaffected Due to ModSecurity Hardening Measures!

The OWASP ModSecurity Core Rule Set team has reported a Denial of Service vulnerability in ModSecurity version 3.x that allows an attacker to send a crafted payload that exploits a flaw in how regular expressions are matched within the software. A CVE (CVE-2020-15598) was assigned to this vulnerability and it has been rated with a CVSSv3 score of 7.5 (high).

Automating incident response with Relay and PagerDuty

DevOps and SRE teams are under intense pressure to reduce the Mean Time to Recovery (MTTR) in resolving incidents. The latest integration between Relay and PagerDuty eliminates the “digital duct tape” by creating reusable, event-driven workflows to close the loop on incidents faster through Relay’s event-based automation approach.

DevOps Automation Best Practices for Automotive Software Delivery

Some cars today boast more than 300M lines of code! Software has become a key differentiator and influencer on consumers’ buying decisions - with many choosing vehicles as much for their infotainment system and “all that tech” as for the horsepower. DevOps for software embedded in vehicles is not trivial. The automotive industry faces unique challenges when it comes to delivering software -- due to complex testing matrix and deployment processes, and its strict safety, regulation and compliance rules.

How to Reduce MTTR with PagerDuty and Relay

DevOps and SRE teams are under intense pressure to reduce the Mean Time to Recovery (MTTR) in resolving incidents. With the proliferation of cloud services and the increasing complexity of DevOps toolchains, engineers today need to not only learn how to use these services but also troubleshoot them when an incident is raised at 2 AM. Incident response is still manual today – cobbling together runbooks and ad hoc scripts and orchestrating people to respond.

5 Reasons Why Demand For Colocation Space Is Growing Across Asia Pacific

Demand for colocation space is continuing to accelerate across the Asia Pacific region. According to research by Global Data, data centre and hosting services revenue is estimated to reach around $32 billion by 2023, giving the region an almost 30% share of the overall global data centre market. Let’s take a closer look at what’s driving that growth…

PagerDuty to Acquire Rundeck

Today is a great day for PagerDuty customers, practitioners, partners, and employees as we’ve entered into a definitive agreement to acquire Rundeck, a Californian start-up that’s a leader and innovator in DevOps automation. Before I get into the technicalities of what our solutions can do together, let me first set the scene on why we decided to do this, now.

How to configure HTTPS for an Nginx Docker Container

There are a few ways to effectively configure HTTPs for an Nginx Docker Container. In this guide, we will quickly cover configuration through the use of free certificate authority Let’s Encrypt. For plenty of people, using Let’s Encrypt to configure HTTPS for an Nginx docker container is a good option. A paid version like Comodo’s SSL certificates may make more sense if you want to increase the security of your site and server.

We raised $1M pre-seed round to simplify application deployment in the Cloud

I am thrilled to announce that we have raised a $1M pre-seed round with top notch investors. Among them are top entrepreneurs and Cloud experts like Alexis Lê-Quôc, co-founder and CTO at Datadog, and Sebastien Pahl, Co-founder of Docker. Qovery will use the funds to strengthen its research and development team and extend their offer to technology companies in Europe and in the US.

Monitoring virtualization platforms and networks

Small and large businesses alike, opt for virtualization to optimize resource management. While you have a whole list options such as VMware, Hyper-V and Nutanix, monitoring them for their availability is just as important. Watch this webinar and learn how monitoring virtualization platforms and the underlying network infrastructure works to your benefit.

ECS cluster with customizable blend of on-demand, spot and reserved instances for granular workload placement

Spot by NetApps’s Ocean now makes it easy to run your ECS tasks on any combination of on-demand, spot and reserved instances all within a single cluster. Ocean provides Amazon Elastic Container Service (ECS) users with an automated, serverless container experience. Previously, control over the underlying instances’ pricing model was limited to utilizing reserved instances and spot instances only.

Reserved instances - How to leverage them without needing to predict the future

As we discussed in our previous post, the comprehensive visibility into your cloud spend provided by Cloud Analyzer allows you to confidently make decisions on how to best optimize your cloud. But when it comes time to actually optimizing your cloud compute spend, taking advantage of reserved instances – a pricing model that offers steep discounts in exchange for long-term commitment – many potential users still hesitate and for good cause.

Seamlessly Immunize Binaries Flowing through Artifactory with RunSafe Alkemist

In this webinar, RunSafe and JFrog will introduce cutting-edge security techniques, allowing users to protect both source and binary code flowing through their pipelines from memory based attacks. Includes a walkthrough of a real world exploit where Alkemist was successful at mitigating the attack in Apache/PHP.

Technology Business Management and Chaos Engineering

Get started with Gremlin’s Chaos Engineering tools to safely, securely, and simply inject failure into your systems to find weaknesses before they cause customer-facing issues. Technology Business Management (TBM) is a decision-making tool that helps organizations maximize the business value of information technology (IT) spending by adjusting management practices. With TBM, IT is transformed to run like a business instead of merely a cost center.

Guide to Kubernetes Monitoring: Part 1

Kubernetes is one of the hottest topics in IT right now, but what exactly is it and where did it come from? As DevOps and Infrastructure-as-Code practices arose and took hold in the IT/OPS community over the past decade, the logical continuation of those ideas was a system for automating the management of the software itself. So Google stepped in and offered its own software as a solution, releasing Kubernetes as open-source in 2014.

Accelerating Root Cause Analysis of IT Incidents

The moment after an incident is resolved is perhaps the most relaxing for any IT team. When your system is finally functioning properly it puts the entire organization at ease, but the most daunting task is yet to come: root cause analysis (RCA). Akin to football teams watching previous plays to pinpoint areas of improvement, root cause analysis goes through data and finds what initially caused the incident.

VMware Tanzu Mission Control Expands Its Policy Management Capabilities

We are excited to announce the general availability of security policies and policy insights in Tanzu Mission Control. With the launch of these new capabilities, administrators can easily streamline and manage the security of their Kubernetes cluster fleet. They can also take advantage of the rich policy insights dashboard, which provides a centralized and holistic view of the current state of all policy events in their system.

Availability, Maintainability, Reliability: What's the Difference?

We live in an era of reliability where users depend on having consistent access to services. When choosing between competing services, no feature is more important to users than reliability. But what does reliability mean? To answer this question, we’ll break down reliability in terms of other metrics within reliability engineering: availability and maintainability. Distinguishing these terms isn’t a matter of semantics.

Shipping Metrics from Hashicorp Consul with ELK and Logz.io

Microservices interact in so many ways. Load balancers, security authentication, and service discovery are just the tip of the iceberg. It can get confusing, if not outright messy. But why be messy when you can be meshy? This is where service meshes come into play, linking the roles these tools have in a common ‘net’ that ties and weaves the whole architecture together. Hashicorp has produced one of the most popular of these organizational assets — Consul Connect.

Tanzu Tuesdays - Production-Ready Kubernetes Clusters with VMware Tanzu - Tiffany Jernigan

An expanded version of her Spring One talk: Make Your Kubernetes Clusters Production-Ready with VMware Tanzu When you first started experimenting with Kubernetes, you may have started locally or on a set of servers. With simple applications, you may only have used a container registry and Kubernetes itself. When looking to move your clusters to a production setting, there are many more considerations, such as: How will I manage my clusters? How do I handle monitoring and logging? How do I safely back up my cluster resources? How do I ensure that my container images are safe and secure?

How to view the size of all your Azure Storage Accounts and Blobs

As more and more organisations dive into Azure, storage consumption continues to grow and so does the cost to businesses. Azure offers almost a limitless supply of storage, but this comes at a cost so it’s important to know exactly where that storage is going. There are a few ways to get this information, either via the Azure portal, Azure Storage Explorer or even PowerShell. However, all these tools have limitations and to be honest, rather lacking and not that straightforward.

A Beautiful ITSM Union: ITIL and DevOps

Since the launch of ITIL 4, incorporating DevOps into service management strategy has been a hot topic. On the surface, both DevOps and ITIL are frameworks that can help facilitate successful operations surrounding IT services. But that doesn’t mean that IT pros need to choose one or the other. Like most great marriages, it’s how these two methodologies complement each other that makes them an ideal pair when it comes to ITSM.

Top Go Modules: Golang Web APIs with GORM

Robert Greiseimer has called Go the language of cloud computing and while it’s no secret that Go has strong features that support the needs of microservice architecture, distributed systems, and large-scale enterprise applications, what is less talked about is that Go was also built with web development in mind from the start. In fact, many developers in the community are using Go for full-stack development and championing new modules and frameworks that make Go a strong language for the web.

Kublr 1.19 Continues Expanding Kubernetes Operations Capabilities, Supports Control Plane In-place Upgrades

With the release of Kublr 1.19, we are continuing the tradition of expanding customization capabilities available to end users and Kubernetes operators and administrators. Kublr 1.19 includes numerous improvements to the customization of Kubernetes clusters deployed on AWS and other clouds. Key among these is support for mixed instance policies including spot and on-demand instances and multiple instance types.

Introducing Boolean-filtered metric queries

Health and performance issues are easier to understand—and to troubleshoot—when you can use tags to aggregate your data across many overlapping scopes. But while some scopes come directly from your infrastructure, others are constantly evolving to reflect the needs of your product or organization. You can only track your data effectively if you can define—and redefine—your scopes on the fly.

2 ways to set up static IP addresses for ALB

One highly requested feature of AWS’s Application Load Balancer is the ability to assign static IP addresses. Unfortunately, ALBs do not support this feature and it is unlikely they will in the near future. Today, the only way to achieve static IP addresses for your application behind an ALB is to add another layer in between the client and your ALB which does have a static IP address, and then forward requests to your ALB.

Introducing Serverless360 Cloud Docs (Preview)

Cloud Docs feature in Serverless360 helps you to document your Microsoft Azure Subscription. It comes with the capability to aggregate data from disparate Resource Providers in Microsoft Azure in a single report. This allows for the creation of composite technical documentation across resources enabling richer insights that would otherwise be impossible. Interpreting your cost and resource information on Microsoft Azure subscription into legible documentation is what Cloud Docs are for.

Netdata named to the Forbes Cloud 100 Rising Stars

We’re excited to announce that we’ve been named to the Forbes 2020 Cloud 100 Rising Stars. This is a list of the top 100 private cloud companies in the world, published by Forbes in partnership with Bessemer Venture Partners and Salesforce Ventures. The 20 Rising Stars represent young, high-growth and category-leading cloud companies who are poised to join the Cloud 100 ranks.

Netdata Agent v1.25 and Cloud enhancements

The v1.25.0 release of the Netdata Agent delivers on our commitment to make our metrics collection, visualization, and troubleshooting platform more stable and usable. We enhanced our recently-added Prometheus collector with user-configurable filtering and grouping, made dramatic improvements to the reliability of the Agent-Cloud link that streams metrics on-demand to your browser when you use Netdata Cloud, and more. Let’s jump in and look at each improvement.

Netdata versus Datadog: root cause analysis with metric correlations

When an incident strikes, and every minute spent on root cause analysis delays the time to resolution, the real-world consequences can be dire. Troubleshooting an event requires a certain data set: every metric, at the greatest granularity, in one place, available in real time. Limits on the number or type of metrics, collection frequency, or time to visualization can mean the difference between timely resolution and unacceptable losses in time, money, and productivity.

Introducing our first Netdata Cloud Insights feature: Metric Correlations for faster root cause analysis

Today, we are excited to launch our first Netdata Cloud Insights feature, Metric Correlations, developed for discovering underlying issues more quickly and identifying the root cause more efficiently. Read on to learn more about our approach to developing this new feature, how it works, and the many benefits you’ll find incorporating this into your team’s troubleshooting workflow.

CIO Insights: The New Normal and Cloud Mobility

As I wrote in a previous blog post, the world has recently undergone unprecedented changes that have wreaked havoc for CIOs as they struggle to ensure operational continuity, especially in scenarios where extreme changes happen overnight. What does operational continuity look like as businesses move forward in the framework of the new normal? In the earlier blog post, I highlighted some significant paradigm shifts the new normal includes, with a specific focus on these areas.

Monitor Your Azure VM's Using Event Grid and Logic Apps

With the accelerated pace of digital transformation, DevOps, adoption of new platforms, and also managing cloud resources are becoming increasingly challenging for central IT. Applying available best practices, compliance requirements and cost management are adding to the challenge. With the Serverless technologies, customers can apply such policies to cloud resources and run them over a long time.

Reimagine All You Have Learned: APM and the Skills Gap

APM tools have been formerly and primarily siloed in the application development arena, with only the most important and mission-critical applications having their APM instrumentation extended into production use due to complexity and cost. In the modern world of application monitoring, the requirements for Dev and Ops need to be tightly integrated.

Today's Big Leap for Tomorrow

Today is a momentous day for JFrog, as we’re excited and proud to join the Nasdaq family of listings. While COVID-19 challenges every company and prevents us from being together in many ways, we’re humbled that Times Square was turned green today! This is obviously an important milestone, and it couldn’t have happened without over a decade of hard work and millions of hours that have gone into this amazing company.

Manage Your Splunk Infrastructure as Code Using Terraform

Splunk is happy to announce that we now have a Hashicorp verified Terraform Provider for Splunk. The provider is publicly available in the Terraform Registry and can be used by referencing it in your Terraform configuration file and simply executing terraform init. If you're new to Terraform and Providers, the latest version of Terraform is available here. You will need to download the appropriate binaries and have Terraform installed before using the provider.

How to Get Started Using vSphere with Tanzu for Tanzu Basic and Tanzu Standard

In this video, we look at the process for getting started using vSphere with Tanzu employing the Virtual Distributed Switch. This is enabled by Tanzu Basic and Tanzu Standard licensing with Enterprise Plus. The process is for the complete setup and configuration of Workload Management and also deploying your first Tanzu Kubernetes Grid cluster.

How Automation Helps The Site Reliability Engineer

Automation has been with us for decades now and with years of experience and experimentation we are arriving at a best practice known as site reliability engineering. Site reliability engineering seeks to manage the risk imposed from multiple agile changes to protect business revenues and sustain positive customer experiences.

State of IT 2021 Preview: A Global Crisis Brings Big Changes to IT

What a year 2020 has been! We’re all living through a shared experience, where everyone has been forced to navigate challenges presented by the COVID-19 pandemic. And in this new reality, far-reaching changes have been made to ensure public safety, some of which will continue well into the future. For example, amid the lockdowns and reduced economic activity, businesses were forced to take cost cutting measures to survive.

Is That Bot Really Googlebot? Detecting Fake Crawlers with HAProxy Enterprise

Detect and stop fake web crawlers using HAProxy Enterprise’s Verify Crawler add-on. How your website ranks on Google can have a substantial impact on the number of visitors you receive, which can ultimately make or break the success of your online business. To keep search results fresh, Google and other search engines deploy programs called web crawlers that scan and index the Internet at a regular interval, registering new and updated content.

Deploy your Kubernetes clusters on-premises with AWS Outposts

Spot by NetApp is excited to announce our designation as an AWS Outposts Ready Partner, as part of the (Amazon Web Services) AWS Service Ready Program. Ocean by Spot can now be deployed on AWS Outposts, bringing the serverless container experience to workloads that require the performance, low latency and availability of on-premise.

An Introduction to Kubernetes and Its Uses

It's easy to get lost in today's continuously changing landscape of cloud native technologies. The learning curve from a beginner's perspective is quite steep, and without proper context it becomes increasingly difficult to sift through all the buzzwords. If you have been developing software, chances are you may have heard of Kubernetes by now. Before we jump into what Kubernetes is, it's essential to familiarize ourselves with containerization and how it came about.

Rancher Recognized as a Leader in Latest Forrester Wave

The enterprise Kubernetes management space has definitely become a lot more crowded over the past two years as traditional vendors and startups alike attempt to grab a slice of this massive market. The increasingly competitive vendor landscape makes Forrester’s recent recognition of Rancher Labs that much more meaningful.

What is Docker Monitoring?

We have come a long way in the world of computing. From having computers that fill up entire rooms or buildings while performing relatively basic actions to having complex machines that literally fit in our pockets and palms, this advancement has been nothing short of breathless. With an emphasis placed on speed and efficiency, computers and the applications running on these computers have been tailored to ensure optimal use of resources, be these resources hardware or software resources.

Keeping Clean with CloudZero Dashboard: Our Latest Updates

Here at CloudZero, we’ve made some updates to our dashboard that we’re excited to share with you! I actually prefer this original definition. When you hear the word dashboard, if you’re not thinking about software, you’re probably picturing the place in a car where you have various dials and readouts for safe operation of the vehicle. But did you know what the term dashboard predates cars?

Security corner: snap interface & snap connections

One of the defining features of snaps is their strong security. Snaps are designed to run isolated from the underlying system, with granular control and access to specific resources made possible through a mechanism of interfaces. Think of it as a virtual USB cable – an interface connects a plug with a slot. Security and privacy conscious users will certainly be interested in knowing more about their snaps – what they can do and which resources they need at runtime.

How to Accelerate App Modernization using CloudHedge

Maintaining legacy applications can be an affliction that saps up energy, time, and resources. Application modernization remains fashionable and involves refactoring, re-purposing, or consolidating legacy software to align it more closely with current business needs and add business value. Traditional methods for modernizing applications include rewriting existing application code to a more modern programming language to salvage parts of the application that might still have value.

Simplify Your Approach to Application Modernization with 4 Simple Editions for the Tanzu Portfolio

We recently announced four new VMware Tanzu editions, each of which packages capabilities of the Tanzu portfolio into a solution that directly addresses a single, common customer challenge. Your effort to modernize applications is already complex. Tanzu editions simplify your access to the tools you’ll need to move forward. Before walking through each of the four new editions, it’s important to first call out the characteristics that are common to all of them.

Why Admins HATE Their Backups

Many of us hate our backup environments. That’s because backups kind of suck, even with a backup product as great as IBM Spectrum Protect. As I said in another post, it’s the thing that everyone needs, but no one cares about, and most definitely can make your life crappy. Ask any backup admin, and I know they’ll agree. Go ahead; I’ll wait. Yep, they said the same thing, didn’t they?

Monitor AWS Step Functions with Datadog

AWS Step Functions is a service that abstracts distributed applications into state machines, with each state representing a component of an application. Not only does this automatically generate an architectural diagram of your application’s workflow, it also makes it straightforward to reorder your states as well as implement parallel execution, retries, and other tasks.

Is Kubernetes Delivering on its Promise?

A headline in a recent Register article jumped off my screen with the claim: “No, Kubernetes doesn’t make applications portable, say analysts. Good luck avoiding lock-in, too.” Well, that certainly got my attention…for a couple of reasons. First, the emphasis on an absolute claim was quite literally shouting at me. In my experience, absolutes are rare occurrences in software engineering. Second, it was nearly impossible to imagine what evidence this conclusion was based on.

Automation and changing needs, featuring Forrester

In an ever-changing world, the future of work is changing as well, and it has accelerated some areas of automation that we were already moving toward. I sat down with our guest speaker, Leslie Joseph, Principal Analyst Serving Application Development and Delivery at Forrester Research, for a webinar to discuss these questions and get a better understanding around how automation plays an important role in supporting companies through crises and preparing them for an uncertain future.

Understanding your application's critical path

Don’t wait for an incident to focus on reliability. Learn concrete steps for preventing incidents in the first place in our two-part series, Planning and Architecting for Reliability. It’s 3 a.m. You’re lying comfortably in bed when suddenly your phone starts screeching. It’s an automated high-severity alert telling you that your company’s web application is down. Exhausted, you open the website on your phone and do some basic tests.

Virtana Offers Cost-Effective, Plug-and-Play Alternative as NetApp Sunsets OCI Monitoring and Optimization Platform

San Jose, CA, September 15, 2020 —OnCommand Insight (OCI) users worried about ongoing support, updates, and upgrades for NetApp’s legacy tool now have an alternative platform to migrate to that is operational in 250+ of the largest enterprises as a future-proofing multi-cloud solution, proven to avoid disruption. OCI users can immediately transition to VirtualWisdom by Virtana with plug-and-play ease and financial incentives.

Repository Webhooks: Notifications for DevOps

Webhooks, so what are they good for? Well, quite a lot as it turns out! Webhooks are great for integrating Cloudsmith with other systems that you use, by sending data or notifications to other tools in your stack and helping to enable automation across your workflows. I know what you’re thinking, this sounds a lot like an API right? Well, not quite. Webhooks are almost like a sibling of an API call. So, what’s the real difference?

An Introduction to Testing Robot Code

The myriad of different fields that make up robotics makes QA practices difficult to settle on. Field testing is the go-to, since a functioning robot is often proof enough that a system is working. But online tests are slow. The physical environment must be set up. The entire system has to be in a workable state. Multiple runs are needed to build confidence. This grinds development to a halt.

The State of Robotics - August 2020

So that’s the summer gone (hopefully, that heat was awful). Or winter if that’s where you are. Seasons change and so does the state of robotics. Fortunately, that’s what we’re here for. Before we get into it, as ever, If you’re working on any robotics projects that you’d like us to talk about, be sure to get in touch.

SRE Leaders Panel: Testing in Production

Blameless recently had the privilege of hosting some fantastic leaders in the SRE and resilience community for a panel discussion. Our panelists discussed testing in production, how feature flagging and testing can help us do that, and how to get managers to be on board with testing in production. The transcript below has been lightly edited, and if you’re interested in watching the full panel, you can do so here.

Observability vs Monitoring

So what exactly is observability? Is it just a new-fangled term for 'monitoring'? Well, no. Observability goes further than mere monitoring. Observability involves the combination of 3 pillars – Metrics, Logs, and Tracing – to give a much more in-depth view of what your application is doing. Observability offers proactive insights into how your application and/or infrastructure are likely to behave, whereas monitoring is only reactive in nature.

6 Critical Requirements for Effective Application Infrastructure Monitoring

The cloud gets all the press today, and while organizations are moving more and more of their applications and associated infrastructure into the cloud, there is still a lot of “down below” on-premises. A recent cloud computing survey from IDG shows that a clear majority of companies plan to use cloud services for over half of their infrastructure and applications.

DevOps and the Cloud: 5 Ways DevOps And the Cloud Will Come Together in 2020

More and more companies are beginning to turn to DevOps and the cloud as a way to improve their software teams. Whilst it used to be that development and operations were seen as separate, that view has now changed. Linking the two leads to better communication, faster development times, and the ability to stay on top of things.

Kubernetes as a New Standard for Infrastructure Management

For IT teams inside large organizations used to managing any number of operating environments, Kubernetes is a breath of fresh, standardizing air. Forget its origins, forget any excitement over containers or microservices, and forget the sprawling ecosystem of related projects. What has some folks charged with managing Kubernetes deployments really excited is the prospect of managing all application infrastructure essentially the same way.

Building and deploying a Docker image to a Kubernetes cluster

Deploying Docker images to Kubernetes is a great way to run your application in an easily scalable way. Getting started with your first Kubernetes deployment can be a little daunting if you are new to Docker and Kubernetes, but with a little bit of preparation, your application will be running in no time. In this blog post, we will cover the basic steps needed to build Docker images and deploy them to a Kubernetes cluster.

Essential Observability Techniques for Continuous Delivery

Observability is an indispensable concept in continuous delivery, but it can be a little bewildering. Luckily for us, there are a number of tools and techniques to make our job easier! One way to aid in improving observability in a continuous delivery environment is by monitoring and analyzing key metrics from builds and deploys. With tools such as Prometheus and their integrations into CI/CD pipelines, gathering and analysis of metrics is simple. Tracking these things early on is essential.

12 Easy Ways to Improve Command Center Operations | Netreo On-Demand Webinars

Command Centers often struggle with limited visibility — especially shared visibility between teams. Additionally, teams are using loosely coupled discrete tools that create information silos. As a result, there is lack of communication causing redundant efforts and slow issue resolution. So, how do you address these challenges to improve Command Center operations?

5 Little Known Ways to Simplify Systems and Network Monitoring | Netreo On-Demand Webinars

Some of the most common challenges in systems and network management include over-alerting, too much administrative overhead, and consistently being stuck firefighting issues instead of preventing them. To help overcome these issues, we’ve identified 5 simple ways to simplify monitoring within your IT infrastructure.

5 Tips to Manage Multi-Cloud and Serverless Enterprise Environments | Netreo On-Demand Webinars

More than 60% of enterprise workloads are already hosted in the cloud, and that number is only expected to rise in 2019. 81% of enterprises are using a multi-cloud strategy. And yet, many organizations struggle with managing application performance and user expectations, even after the day to day administration of the server hardware has disappeared into the cloud. This expert led webinar explores real-world solutions to the most common cloud management challenges, and how to make the most effective use of your tools, process, and monitoring strategy to make sure you’re exceeding your SLAs and business objectives.

Track, Debug, and Fix Errors with Sleuth and Sentry

Learn how the Sleuth-Sentry integration gives you a complete view into your deployment tracking and health! Join us for a virtual webinar with Sleuth co-founder Don Brown and Sentry Product Marketing lead Rahul Chhabria as we walk you thru the benefits of the integration and the insights the combined solution will bring you.

Achieving CI Velocity at Tigera using Semaphore

Tigera serves the networking and policy enforcement needs of more than 150,000 Kubernetes clusters across the globe and supports two product lines: open source Calico, and Calico Enterprise. Our development team is constantly running smoke, system, unit, and functional verification tests, as well as all our E2Es for these products. Our CI pipelines form an extremely important aspect of the overall IT infrastructure and enable us to test our products and catch bugs before release.

Exploring AWS Lambda Deployment Limits

We have explored how we can deploy Machine Learning models using AWS Lambda. Deploying ML models with AWS Lambda is suitable for early-stage projects as there are certain limitations in using Lambda function. However, this is not a reason to worry if you need to utilize AWS Lambda to its full potential for your Machine Learning project. When working with Lambda functions its a constant worry about the size of deployment packages for a developer.

Enhancing the DevOps Experience on Kubernetes with Logging

Keeping track of what’s going on in Kubernetes isn’t easy. It’s an environment where things move quickly, individual containers come and go, and a large number of independent processes involving separate users may all be happening at the same time. Container-based systems are by their nature optimized for rapid, efficient response to a heavy load of requests from multiple users in a highly abstracted environment and not for high-visibility, real-time monitoring.

Implementing infrastructure as code with Ansible

If you’re here, it means that your application is a hit, coming through a long way of development and deployments. Your application is finally in a stage where you or your team need to set up more servers than you can handle manually, and you have to provision them fast. There’s also the need to make sure that all of them have the same configuration, packages, and versions in order for your application to have the same behavior in all of them.

Node.js Resiliency Concepts: Recovery and Self-Healing

In an ideal world where we reached 100% test coverage, our error handling was flawless, and all our failures were handled gracefully — in a world where all our systems reached perfection, we wouldn’t be having this discussion. Yet, here we are. Earth, 2020. By the time you read this sentence, somebody’s server failed in production. A moment of silence for the processes we lost.

Integrate AWS Services into Rancher Workloads with Triggermesh

Many businesses use cloud services on AWS and also run workloads on Kubernetes and Knative. Today, it’s difficult to integrate events from AWS to workloads on a Rancher cluster, preventing you from taking full advantage of your data and applications. To trigger a workload on Rancher when events happen in your AWS service, you need an event source that can consume AWS events and send them to your Rancher workload.

Are you on top of newly introduced errors in your CI/CD releases?

Log files are infamous for being “noisy”. Without the right management solution, trying to find a specific piece of information or using them to reproduce a critical error is a complex undertaking. If you’re working with CI/CD, how do you attribute new errors to a particular release? How do you investigate those errors and make sure that your customers aren’t being impacted? Faster releases mean shorter development and testing cycles before new code reaches production.

Need to Kickstart Your Digital Transformation? Start By Changing Your POV

We hear the terms all the time: agile, transformation, developer productivity, employee happiness. Unfortunately, transformation that improves both product and delivery—and that is continuous—can be challenging. Meaningful evolution is hard when everybody involved comes into a transformation process with all sorts of biases deeply embedded.

From beta tester, to building the next-gen Civo platform

There are times in life that feel like they are detached from reality. Some call it divine intervention, others use more modern, hippie-ish ways to explain these moments. Call it what you will, nearly everyone has experienced some form of this occurrence. Some people have been short on cash and found a $50 note on the ground. Others have lost jobs only to find their dream job on the way to their car after getting walked out by security.

How to Improve the Reliability of a System

Site reliability engineering is a multifaceted movement that combines many practices, mentalities, and cultural values. It looks holistically at how an organization can become more resilient, operating on every level from server hardware to team morale. At each level, SRE is applied to improve the reliability of relevant systems. With such wide-reaching impact, it can be helpful to take time to reevaluate how to improve the reliability of a system.

Become FIPS Compliant with HAProxy Enterprise on Red Hat Enterprise Linux 8

Guarantee strong encryption by enabling ‘FIPS mode’ with RHEL and HAProxy Enterprise. SSL and its successor TLS are protocols that safeguard web traffic as it crosses the Internet, encrypting communication and protecting it from tampering. However, the encryption algorithms within these protocols are subject to change over time as vulnerabilities are discovered or as better encryption methods become available.

Client-side chaos: Making your front end more reliable

Get started with Gremlin’s Chaos Engineering tools to safely, securely, and simply inject failure into your systems to find weaknesses before they cause customer-facing issues. The concept of Chaos Engineering is most often applied to backend systems, but for teams building websites and web applications, this is only half of the story.

Driving Kubernetes Adoption in Finance with Rancher

In Switzerland, Inventx is the IT partner of choice for financial and insurance service providers. Its full-stack DevOps platform, ix.AgileFactory, allows financial organizations to move to a modern, cloud-native and microservices-centric infrastructure. The platform decouples core applications from the central infrastructure, allowing organizations to better manage and innovate applications in safety.

Track, Debug, and Fix Errors with Sleuth and Sentry

Developer teams shipping software frequently are in a constant state of change. Understanding the state of their code at a given point of time is sometimes clear as mud. The Sentry | Sleuth integration is focused on helping developers automate the annoyances of deploying software, tracking the health of a release, and providing clarity on how to resolve critical code issues.

SRE + Honeycomb: Observability for Service Reliability

As a Customer Advocate, I talk to a lot of prospective Honeycomb users who want to understand how observability fits into their existing Site Reliability Engineering (SRE) practice. While I have enough of a familiarity with the discipline to get myself into trouble, I wanted to learn more about what SREs do in their day-to-day work so that I’d be better able to help them determine if Honeycomb is a good fit for their needs.

Instant Insights for Troubleshooting Your Spring Boot Applications and Spring Cloud Data Flow Pipelines

Looking for a way to proactively troubleshoot complex application performance issues? Look no further than Tanzu Observability by Wavefront, which provides easy data ingestion and preconfigured dashboards and can be set up with Spring Boot and Spring Cloud Data Flow (SCDF) integrations.

Building Images Faster and Better With Multi-Stage Builds

There is no doubt about the fact that Docker makes it very easy to deploy multiple applications on a single box. Be it different versions of the same tool, different applications with different version dependencies - Docker has you covered. But then nothing comes free. This flexibility comes with some problems - like high disk usage and large images. With Docker, you have to be careful about writing your Dockerfile efficiently in order to reduce the image size and also improve the build times.

How Canonical remotely delivers and supports customer cloud deployments

The widespread shift to remote working in response to the COVID-19 pandemic has been a disruptive change for countless businesses; some 13% of organisations say they have faced major disruption. But at Canonical, remote working has long been the status quo for many of our teams. In spite of the challenging circumstances in which we all find ourselves, Canonical has been able to continue to operate and support our customers despite their working practices undergoing significant changes.

Managing your cloud spend - from problem identification to problem solving

As we continue from our previous post on FinOps vs. DevOps let’s review the primary challenge facing all cloud consumers – identifying and managing current and potential cloud waste. In other words, understanding how efficient your cloud strategy and implementation actually is.. Controlling your cloud spend through a simple visualization is the first step to tackle the problem. Cloud Analyzer, a Spot by NetApp cost optimization tool, is a great starting point.

How to Seamlessly Switch AWS Partners

Working with the right AWS provider can make or break a company, but many companies discover that after a few years, what was once a great fit just doesn’t work anymore. Over time, your needs change, and the provider you’ve been with for years might not be able to provide what you need. Alternatively, maybe your AWS provider simply isn’t living up to your expectations, or perhaps your company is looking to redesign their cloud infrastructure. When this happens, what are your options?

Monitoring as code with Terraform

We try to automate as much as possible in our environments, but we often treat monitoring as an afterthought. In this episode of Stack Doctor, we show you how to automate your monitoring configurations via Terraform. Watch to learn how you can automate the creation of common resources - such as uptime checks, alerting policies, and dashboards - with Terraform!

Calculating IOPS Utilization for EBS Volumes

When looking at an EBS volume in CloudWisdom, you’ll notice that in addition to the metrics we collect from AWS, we also create a number of computed metrics, one of which is netuitive.aws.ebs.iopsutilization. Simply put, IOPS Utilization compares the current number of IOPS that the disk is performing against the total IOPS capacity, and expresses this as a percentage. Thus, if you are currently running 1050 IOPS against a volume whose capacity is 3000 IOPS, the IOPS Utilization would be 35%.

Kubernetes vs. Docker

Kubernetes and Docker each play a vital role in modern, microservices-based application development. Since Kubernetes and Docker work in unison to help develop, deploy, and manage large-scale applications – they are not mutually exclusive technologies and they are certainly not in competition with each other. Nevertheless, Kubernetes and Docker are often misunderstood by the non-developer community. To clear up the confusion around Kubernetes vs. Docker, we’ve written this guide.

LogicTalks - How Harvard Gained Visibility and Operational Confidence through Monitoring

In this episode of LogicTalks, Mark Banfield, Chief Revenue Officer at LogicMonitor, is joined by Ken Perry, Product Manager and Technology Monitoring Architect at Harvard University to discuss how LogicMonitor has shifted Harvard's monitoring strategy. Ken explains how LogicMonitor has helped to break down monitoring silos between departments, solve unique challenges and use cases within such a large organization, and how LogicMonitor aided Harvard in it's transition to remote learning during the COVID pandemic all while helping to build operational confidence throughout Harvard and it's leadership.

Architectural decisions that impact Kubernetes costs

One of the mistakes organizations make related to Kubernetes costs is addressing them primarily after-the-fact, once the application is running successfully. There are certainly changes that can be made to improve efficiency once the application is running, but cost-control measures are best considered at the beginning, not middle or end, of the application lifecycle.

Understanding the Complete Cloud Cost of Kubernetes

When organizations think about the relationship between Kubernetes and cloud costs, they often focus on Kubernetes’ auto-scaling capabilities and what this means for optimizing compute resources. Kubernetes does allow organizations to provision compute resources more thinly, because the platform allows them to scale up automatically if there’s a demand spike in the middle of the night.

Node.js Microservices: Developing Node.js Apps Based On Microservices

Node.js application developers, in the ever-evolving business landscape, enjoy tangible advantages while incorporating microservices in Node.js apps development. The microservice architecture, or microservices, is a distinct method of software systems development, which attempts to create modules that are single-function, with well-defined operations and interfaces.

Azure Kubernetes Service: How to create a cluster

Azure Kubernetes Service, Microsoft's managed Kubernetes solution, allows you to quickly create a Kubernetes cluster in Microsoft Azure and provides features to help you manage and maintain your Kubernetes cluster in Azure. In this blog post we will go over some of the features of AKS and then walk through creating an AKS cluster.

Industry Experts Explain how to Thrive in a Post-COVID World

With complex architectures, gaining visibility into systems is becoming more difficult. Additionally, with the move to remote work, it’s more important than ever before to adapt to new modes of work such as asynchronous collaboration. So how do we adjust to these changing times? In a CIO panel hosted by Lightspeed Venture Partners, industry experts came together to discuss these questions. Below are key insights from their conversation.

IT Operations Productivity Now and Beyond

IT Operations teams are at the forefront of supporting enterprise needs for reliability and productivity in this era of remote work, while also supporting critical revenue-driving new digital initiatives. The tools they select and processes they adopt will be instrumental to outcomes in the coming months. Join us for a live video chat with Bhanu Singh, the product and operations leader at OpsRamp, to hear about emerging trends that will help IT Ops teams thrive amid chaos.

Alerts vs Incidents vs ITSM

In order to effectively address production issues in your application, you need to have a strong incident response strategy. Incident response starts with an alert which leads to mobilization and response, and finally results in a record of all that happened and was learned from addressing issues. In this session of Dissecting DevOps, learn about the lifecycle of incidents from alert to post mortem and why incident response is as much a strategy as a process.

Top 5 Mobile Application Performance Monitoring Tools

Your app is done and the client is ready to launch! Everything looks great. But how can you ensure that you will achieve your SLA for uptime? How are you tracking revenue growth (& optimizing)? Do you know how many users you have, and what they’re doing at any given moment in the app? What you need is a monitoring platform that will be able to track these different types of data in one place.

How FireHydrant's CI/CD infrastructure fixes bugs faster

Almost everyone knows that working with third-party APIs can be challenging. Sometimes the errors happen unexpectedly. Sometimes the error information that you receive is inaccurate. While most people feel these pains acutely, I’d like to share how we answer these challenges at FireHydrant and how it’s helped us avoid headaches and stress.

DevOpsDays Chicago 2020 Wrapup

DevOpsDays Chicago 2020 was held on September 1, online. It was the first time the conference was held virtually due to the coronavirus pandemic. I was excited to attend for a couple of reasons. First, DevOpsDays Chicago is one of the better known and respected DevOpsDays held in the US. I’d never been able to attend it before, so it was great to get the opportunity. Also, I’d been missing the DevOpsDays community.

Kubernetes vs. Docker: What Does It Really Mean?

“Kubernetes vs. Docker” is a phrase that you hear more and more these days as Kubernetes becomes ever more popular as a container orchestration solution. However, “Kubernetes vs. Docker” is also a somewhat misleading phrase. When you break it down, these words don’t mean what many people intend them to mean, because Docker and Kubernetes aren’t direct competitors.

Tutorial: Getting Started with ROS

ROS, the Robot Operating System, is the platform of choice for robot development. However, the breadth and depth of existing documentation can be daunting for the ROS beginner. Where should you start learning about ROS 2 on Ubuntu? All robots based on ROS and ROS 2 are programmed using five simple but core constructs: In this tutorial and associated video we’ll introduce these concepts with simulated robots.

Integrating Sensu Go into your CI/CD pipeline with sensuctl prune

Since the release of Sensu Go, many in our community have told us Sensu is easier and faster to deploy, more portable, and more compatible with containerized and ephemeral environments (as compared to Sensu Core, the original version of Sensu). In a recent webinar, I talked about integrating Sensu Go with your CI/CD pipeline and how to use the sensuctl prune command to keep your Sensu resources in a declarative state, reducing dependence on traditional configuration management tools.

VMware Tanzu Build Service, a Kubernetes-Native Way to Build Containers, Is Now GA

VMware Tanzu Build Service, a completely new way of building and managing application containers for Kubernetes, is now generally available. You can download an evaluation copy on Tanzu Network today and build your first container in just a few easy steps using our guide. Although Kubernetes ushered in a new era of container-based applications with microservices architectures, the way that containers are built and maintained did not evolve much.

Celebrating issue 50 of Performance Matters

When we first launched Performance Matters a year ago, we didn’t just want to surface the performance stories of the big tech companies; our goal was to share and highlight the hard work of thousands of people making software faster. Since then, we’ve delivered over 550 articles, community ideas, tweets, videos, and the occasional comic strip from every corner of the web to your inbox. Here are the 10 most popular articles from all 50 issues of our weekly performance newsletter. Enjoy!

Determining Error Budgets and Policies that Work for Your Team

SLOs are key pillars in organizations’ reliability journeys. But, once you’ve set your SLOs, you need to know what to do with them. If they’re only metrics that you’re paged for once in a blue moon, they’ll become obsolete. To make sure your SLOs stay relevant, determine error budgets and policies for your teams. In this blog, we’ll look at the basics of error budgeting, how to set corresponding policies, and how to operationalize SLOs for the long term.

Benchmarking 5 Popular Ingress Controllers

Performance has never been more important than in a cloud-native world. Cloud-hosted resources cost money and a slow-loading application can cause a suboptimal ROI. Have you taken the time to tune your Kubernetes ingress controller and proxy? Many organizations don't until it's absolutely necessary, and most users will typically run a default, out-of-the-box configuration. In this demo, we benchmark five popular ingress controllers and put them head-to-head against each other with their default configurations.

Observability in the Cloud-Native Age: Announcing the DevOps Pulse 2020

It’s that time of year again — the DevOps Pulse 2020 is here! Last year, nearly 1,000 engineers around the world provided their insights in the DevOps Pulse 2019 so we could get the community’s perspective on the growth and challenges associated with observability, cloud monitoring and more. As we discovered in last year’s DevOps Pulse, observability is still a major challenge for many organizations.

Multi-Cluster Vulnerability Scanning with Alcide and Rancher

Kubernetes provides the freedom to rapidly build and ship applications while dramatically minimizing deployment and service update cycles. However, the velocity of application deployment requires a new approach that involves integrating tools as early as possible in the deployment pipeline and inspecting the code and configuration against Kubernetes security best practices. Kubernetes has many security knobs that address various aspects required to harden the cluster and applications running inside.

What is AWS Amplify?

Amazon Web Services is the world’s biggest cloud platform, and businesses of all shapes and sizes use it every day to run their businesses. You may find this surprising, but AWS accounts for more than half of Amazon's operating income. Thus, Amazon has a vested interest in getting as many people to use AWS as possible, so it offers a whole bunch of tools to make it easy to use. AWS Amplify is one of these.

Announcing the General Availability of Azure Spring Cloud

Everyone wants their developers to be more productive. Increased productivity means more features and functionality, which leads to more satisfied customers and better business outcomes. That is why, today at SpringOne, we are happy to announce the general availability of Microsoft Azure Spring Cloud—a fully managed service for Spring Boot apps.

I Can See Clearly Now: Dashboarding and Multi I/O as Spring Cloud Data Flow for Kubernetes 1.1 Goes GA

Spring Cloud Data Flow (SCDF) for Kubernetes 1.1 is now generally available, building on the open source SCDF version 2.6 released in August. The Kubernetes-based commercial offering leverages Tanzu Observability by Wavefront for dashboarding and observability, and enables developers to take their data pipelines to the next level with the introduction of Multi I/O for event-streaming applications.

What's New in Spring Cloud Gateway for VMware Tanzu

Spring Cloud Gateway for VMware Tanzu was released January 2020 as a service on Tanzu Application Service (TAS) and was quickly deployed into production by many of our customers. Our focus is to offer the most developer-friendly API gateway experience while still providing the operational configuration, security and governance needed for successful enterprise management.

SpringOne 2020: Day 1 Recap and Highlights

The Spring community virtually converged for the first day of SpringOne. Over 40,000 of our closest friends registered for the event! The VMware team and a rich community of speakers put on quite the show, discussing the state of enterprise development and best practices for getting apps to production. Here’s a look at some of our favorite moments from Day 1.

How to Build Your SRE Team

As you implement SRE practices and culture at your organization, you’ll realize everyone has a part to play. From engineers setting SLOs, to management upholding the virtue of blamelessness, to marketing teams conducting retrospectives on email campaigns, there’s no part of an organization that doesn’t benefit from the SRE mentality.

Datadog and Relay for Incident Response

Datadog is an awesome tool for aggregating and visualizing the metrics that matter to you. Recently, Datadog launched a new Incident Management feature, which allows you to coordinate the activities around a problem that affected your service. In this example, I’ll walk through using Relay to roll back a Kubernetes deployment that caused a service impact, and show how the Datadog Incident timeline can keep everyone working on the incident in sync.

How to Avoid SLA-Killing, Budget-Busting Cloud Performance Problems

There are lots of excellent reasons to move applications into the public cloud. But those benefits cannot come at the expense (pun intended) of performance. Your SLAs, whether explicitly stated and written into contracts or implicitly promised through your commitment to quality, are part of your brand. Falling short is costly. Even if you don’t have to pay penalty fees, your reputation and customer loyalty can take a hit.